I. Japanese Candlestick Chart Techniques
Charts may not speak to you, and they can’t hear you, but they can still communicate with you effectively. Candlestick patterns are a symbolic language of the market, continuously indicating where U-turns occur and where the market may head next.
Most novice traders like to learn Japanese candlestick charts, which monitor price fluctuations and analyze direction by interpreting them. Generally, traders can use three types of charts: line charts, bar charts, and candlestick charts. For a long time, bar charts were the mainstream, but now, even the world’s top traders use Japanese candlestick charts as an additional reference.
II. The History of Japanese Candlestick Charts
In the 17th century, the concept of Japanese candlestick charts was developed and tested, used to monitor the local rice market transactions. Since there was no standard currency at the time, the price of rice became the main medium of trade, serving the role of currency.
By the end of the 17th century, rice exchanges were established to regulate trading. By 1710, there were over 1,300 rice traders. In addition to actual rice, rice warehouse receipts were issued, which were among the world’s earliest futures contracts.
During the early 17th century, the “Tulip Mania” occurred in the Netherlands, where futures contracts also appeared. Tulips became the standard trading medium, even more valuable than gold. The popularity of tulip vouchers caught the attention of the rest of the world, and other countries began to pursue this effective trading method. The number of rice warehouse receipts increased, and a bag of rice became the standard trading amount.
By 1749, although it was believed that there were only 30,000 bags of actual rice in all of Japan, 110,000 bags were traded on the market through “empty rice warehouse receipts.” These were futures contracts for rice warehouse receipts, even if the rice had not been planted or harvested. Now, rice contracts have delivery dates, and if not hedged or closed out, they will be settled with actual delivery.
Today, futures trading volumes are huge, with most commodity futures trading in the United States taking place at the Chicago Mercantile Exchange.
How did Japanese candlestick charts develop? In 1724, Homma Munehisa was born in Japan. Naturally passionate about business, he eventually became a major trader in the Japanese rice market.
Although he did not invent candlestick charts, he actively studied trading psychology and summarized several trading principles. These ideas eventually evolved into the candlestick trading techniques we see today. Initially, candlestick charts were created by hand, a time-consuming and labour-intensive task.
Due to language barriers, Japanese traders were unable to share this trading technique, so Japanese candlestick charts did not become popular initially. This situation continued until a few decades ago. Now, as an important standard choice and a key indicator for price analysis methods, Japanese candlestick charts have become one of the mainstream financial analysis charts, along with bar charts and line charts.
III. Introduction to Single Candlesticks
Japanese candlestick charts monitor price fluctuations within a specific period. The formation of a candlestick is akin to telling a story of market activity, reflecting the market sentiment during that time.
Candlestick charts have become the symbolic language of the market, hinting at future market movements through certain patterns, which is also the source of pips—correctly predicting market direction rather than displaying past trends.
Successful traders spend time studying and understanding the language of charts. When the timing is right for entry or exit, candlestick patterns can emit clear buy and sell signals. The deeper your understanding of candlestick patterns, the greater your advantage in the market.
Japanese candlestick patterns can provide traders with initial signals of direction change, U-shaped callbacks, or reversals. These signals may appear in the form of a single candlestick or as a combination of multiple candlestick lines.
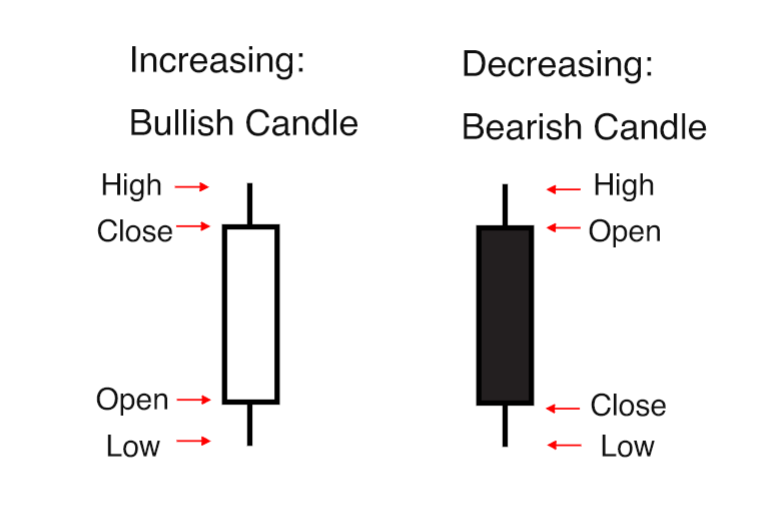
There are hundreds of candlestick patterns, but only a few contain key information about entry points. A good entry point refers to a position where the market moves in the direction of the trade after entry. Let’s take a look at the Japanese candlestick chart and its components, as shown in the figure below.
IV. Introduction to Single Candlesticks in Forex Trading
A single candlestick is composed of a body and shadows, measuring price fluctuations over a certain time period. After the market opens, the body begins to form as prices move up or down. If the closing price is higher than the opening price, the candlestick is called a bullish candle. Bullish candles are hollow or white, indicating bullish characteristics.
If the closing price is lower than the opening price, the candlestick is a bearish candle, represented as solid or black, with bearish characteristics. The lines above and below the body are called shadows. The high point of the upper shadow is the highest price of the period, and the low point of the lower shadow is the lowest price of the period.
You can set it to display candlestick charts for 5-minute, 10-minute, 15-minute, 30-minute periods, or even hourly, daily, weekly, monthly, or yearly charts. Candlestick charts can monitor price fluctuations across various time periods, providing investors with four key pieces of information for a specific time period: opening price, closing price, high, and low.
Trading involves a financial game between two parties: the bulls and the bears. We know there are no real bulls and bears in the market, but investors and traders have tendencies towards a bull or bear market. Both sides have clear goals and want the market to move in their direction: bulls want the market to rise, even surge, continually setting new highs; bears want the market to fall, even plummet, continually setting new lows.
V. Understanding Japanese Candlestick Charts
Most trading beginners use Japanese candlestick charts because they are quite intuitive. As shown in the diagram, the numbers on the far right represent the exchange rate, and the numbers at the bottom indicate the time.
The candlestick on the far right is the current candlestick, displaying the current exchange rate. All the candlesticks to the left of the current one record the historical trend of the chart for that time frame. The icons on the left, top, and right sides are trading tools.
VI. High Points in Forex Trading Market Trends
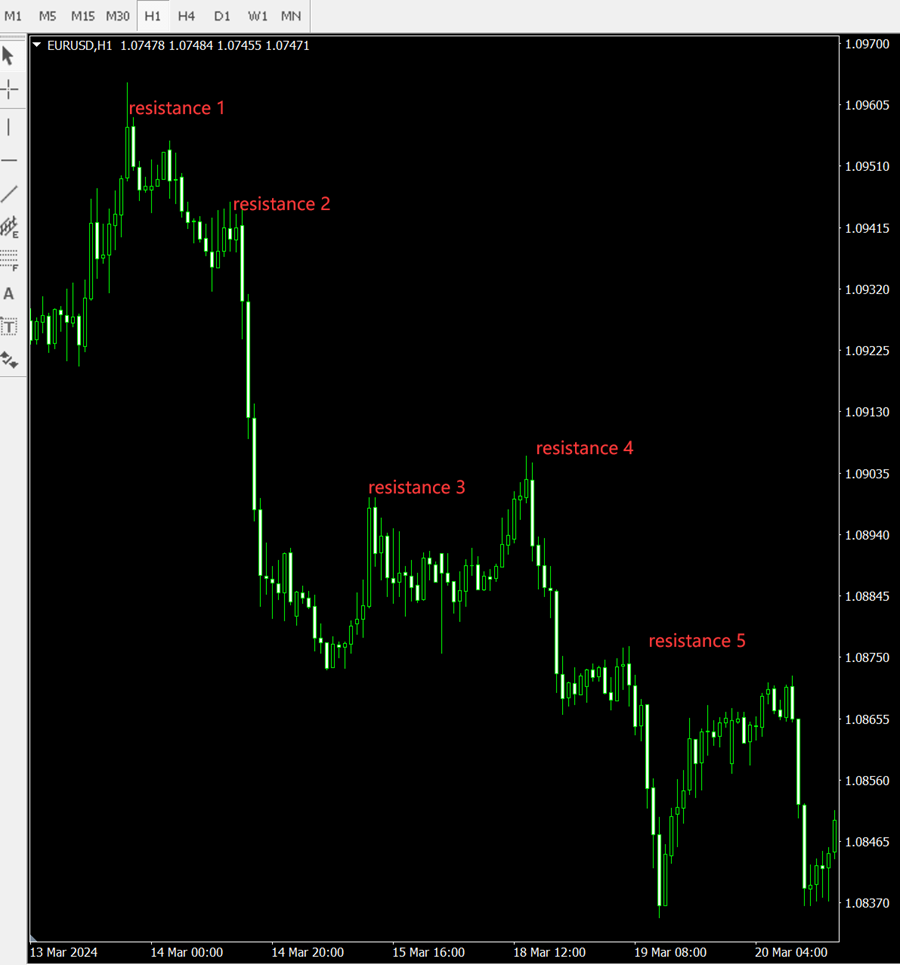
A high point refers to a level where the market stops rising and turns in the opposite direction in a U-shape. To determine a high point, look for a candlestick whose high point is not exceeded by the high points of the two candlesticks immediately to its left and right.
This highest point of the candlestick’s shadow can be identified as a high point. High points are created when bulls push prices to a higher level, but the upward trend is suppressed by bears, making high points new resistance levels.
However, not all high points are major resistance positions. Only those high points that are above the current market price can be considered resistance levels.
In the diagram above, resistance levels are marked as Resistance 1, Resistance 2, Resistance 3, Resistance 4, and Resistance 5, which are the upward targets for the bulls. Once the bulls take control of the market, they will create higher high points and higher low points.
Currently, the bears are maintaining the forex market’s development, leading to lower low points and lower high points.
VII. How to Determine Lows in Forex Trading
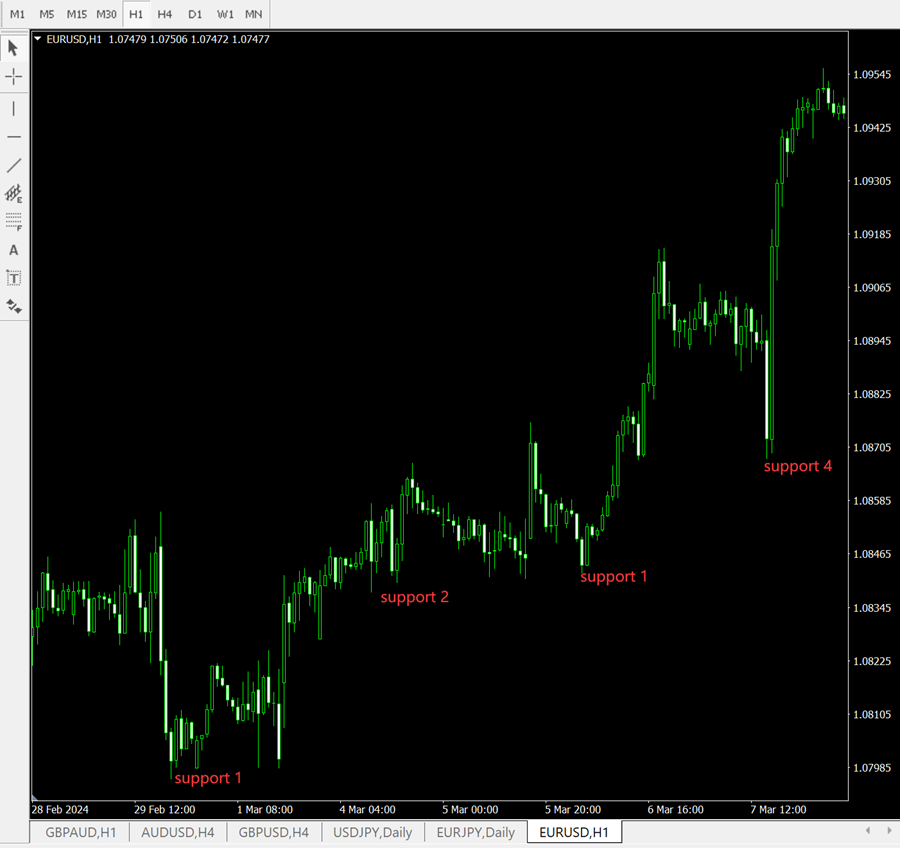
“The term ‘low point’ refers to the level at which the forex market stops falling in a particular area. In candlestick chart patterns, the method for determining a low point is as follows: If both the low points of the candlesticks to the left and right of a particular candle are higher than the lowest point of that candle’s shadow, then the low point of that candle’s shadow can be considered the low point.
When bearish pressure pushes prices to a lower level, but the downtrend is countered by bullish forces, a low point is formed. This low point is considered a new support level. As shown in Figure 4-3, the support levels are labeled as support 1, support 2, support 3, support 4, and support 5. These levels represent the downward targets for bearish traders. When bears dominate the market, they will establish lower lows and lower highs. However, currently, bulls are in control of the market.”
VIII. 18 Different Implications of Japanese Candles in Forex Trading
The art of communication begins with learning the various patterns of communication, including verbal, body language, tone of voice, and so on. Candlestick charts may look similar, but their implications are different. The table below types of patterns that will introduce you to the intrinsic meanings of candlestick shapes.
| Patterns | Candlestick Pattern | Introduction |
|---|---|---|
| Bullish Pattern |  |
Hammer: The Hammer is a bullish candlestick that appears after a significant downtrend. It has a small body and a long lower shadow, indicating that the lowest price was much lower than the opening, high, and closing prices. If this pattern appears after a significant uptrend, it’s called a Hanging Man and is bearish. The Hammer can be either a white (rising) or black (falling) candle. |
| Bullish Pattern |  |
Piercing Line: This bullish pattern is the opposite of the Dark Cloud Cover. It starts with a black candle followed by a white candle. The white candle opens lower than the black candle’s low but closes above the midpoint of the black candle’s body. |
| Bullish Pattern |  |
Bullish Engulfing: This pattern forms after a significant downtrend and indicates a strong bullish trend, suggesting a reversal. It consists of a small black candle followed by a large white candle that engulfs the smaller one. |
| Bullish Pattern |  |
Morning Star: A bullish pattern indicating a potential bottom. A small candle between two larger ones suggests a market reversal, confirmed by the white candle on the right. The middle candle can be either white or black. |
| Bullish Pattern |  |
Bullish Doji Star: This bullish pattern shows market indecision with a single Doji line. After a period of uncertainty, a Bullish Doji Star suggests a potential reversal. It’s best to wait for confirmation, such as the pattern evolving into a Morning Star. The first candle can be either white or black. |
| Bearish Pattern |  |
Inverted Hammer: This forms after a significant uptrend and indicates a strong bearish trend, suggesting a reversal. It consists of a small white candle followed by a large black candle that engulfs the smaller one. |
| Bearish Pattern |  |
Dark Cloud Cover: A bearish pattern where the second candle’s body (closing price) falls below the midpoint of the previous candle’s body, indicating a strong bearish tendency. |
| Bearish Pattern |  |
Bearish Engulfing: This forms after a significant uptrend and indicates a strong bearish trend, suggesting a reversal. It consists of a small white candle followed by a large black candle that engulfs the smaller one. |
| Bearish Pattern |  |
Evening Star: A bearish pattern suggesting a top formation. A small candle between two larger ones suggests a market reversal, confirmed by the black candle on the right. The middle candle can be white, black, or a Doji. |
| Bearish Pattern |  |
Bearish Doji Star: This bearish pattern shows market indecision with a single Doji line. After a period of uncertainty, a Bearish Doji Star suggests a potential reversal. It’s best to wait for confirmation, such as the pattern evolving into an Evening Star before shorting. |
| Bearish Pattern |  |
Shooting Star: This pattern usually appears after an uptrend and has a mild reversal implication. The second candle should have a small body and a typically long upper shadow. |
| Bearish Pattern |  |
Long-legged Doji: This candlestick often signifies a potential trend reversal. It features a close opening and closing price with a wide range formed by the high and low shadows. |
| Bearish Pattern |  |
Dragonfly Doji: This candlestick also often signifies a potential trend reversal. It has the same opening and closing price, with the low significantly below the open, high, and close. |
| Bearish Pattern |  |
Gravestone Doji: This candlestick often signifies a potential trend reversal. It has the same opening, closing, and low price, with the high significantly above the opening, closing and low price. |
| Neutral Pattern |  |
Spinning Top: This is a neutral pattern. It features relatively small ranges between the highs and lows and the opening and closing prices. |
| Neutral Pattern |  |
Doji Star: This candlestick has the same opening and closing price, showing forex market uncertainty. It can form different patterns when combined with other candlesticks. |
| Neutral Pattern |  |
Tweezer Tops and Bottoms: This pattern indicates that the trend might end its current state of uncertainty and break out significantly. |
| Neutral Pattern |  |
Harami: This pattern indicates weakening trend momentum. It features a large first candle followed by a smaller second candle. In this case, the first candle is white and large, and the second is small and black, showing weakening bullish momentum. |
IX. Candlestick Patterns in Forex Trading
The market moves in only three directions: upward, downward, and sideways. During market movements, candlestick charts provide signals for monitoring the market’s strong or weak momentum in a certain direction. Let’s focus on two types of candlestick lines:
- Decisive Candlestick Lines
- Hesitant Candlestick Lines
Decisive candlestick lines refer to large bullish or bearish candles, generally with smaller upper and lower shadows, indicating that the market is under the control of either bulls or bears. In contrast, hesitant candlestick lines are the opposite, with a smaller body, and sometimes no body at all — the opening and closing prices are exactly the same, with either long upper and lower shadows or one significantly long shadow (see below).
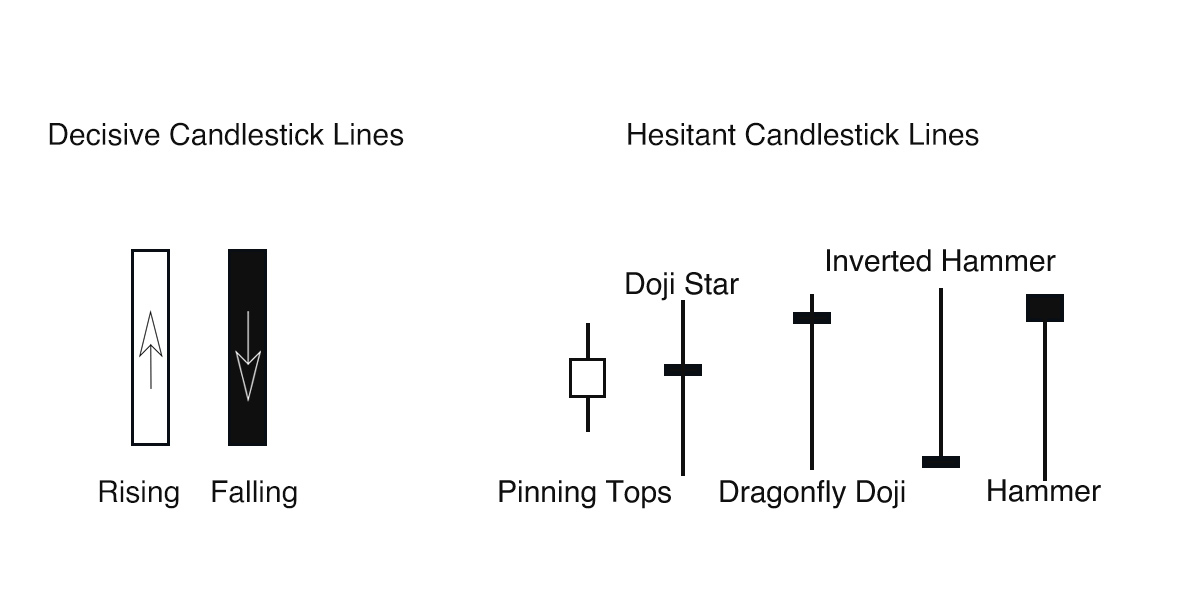
Prices move in a wave-like pattern, and candlestick lines form different shapes. The operation of the market is driven by investors’ entry and exit. When there are more buyers than sellers, the market starts to rise; when there are more sellers than buyers, the market begins to fall; when the number of buyers and sellers is equal, the market moves sideways. Candlestick patterns reveal the market’s strength or weakness. The terms “rising” and “some downward retracement” are mainly used for a rising market, while “falling” and “some upward retracement” mainly refer to a market price decline. As the market moves in waves, candlestick lines will form bullish and bearish reversal patterns. These patterns are signals in the market, as well as buy and sell signals for forex traders, indicating the timing for buying and selling.
X. Bullish Candlestick Patterns or Buy Signals in Forex Trading
Among the multitude of candlestick patterns, there are primarily three bullish and three bearish patterns that provide strong buy and sell signals. The main bullish candlestick patterns are:
- Morning Star
- Bullish Engulfing
- Tweezer Bottom
These candlestick patterns can appear in both uptrends and downtrends. However, their value is exceptional when they appear in an uptrend and are followed by a bullish position, offering significant gains. That is to say, if these patterns appear at the end of a downtrend within a shorter time frame — which is merely a retracement in a longer-term uptrend — their significance is substantial.
It’s important to note that sometimes the market may move sideways within a 20 to 40 points range, possibly forming various bullish and bearish candlestick patterns. These patterns should be ignored, and you should not trade based on these candlestick patterns during such minor fluctuations and sideways movements.
XI. Morning Star (Buy Signal)
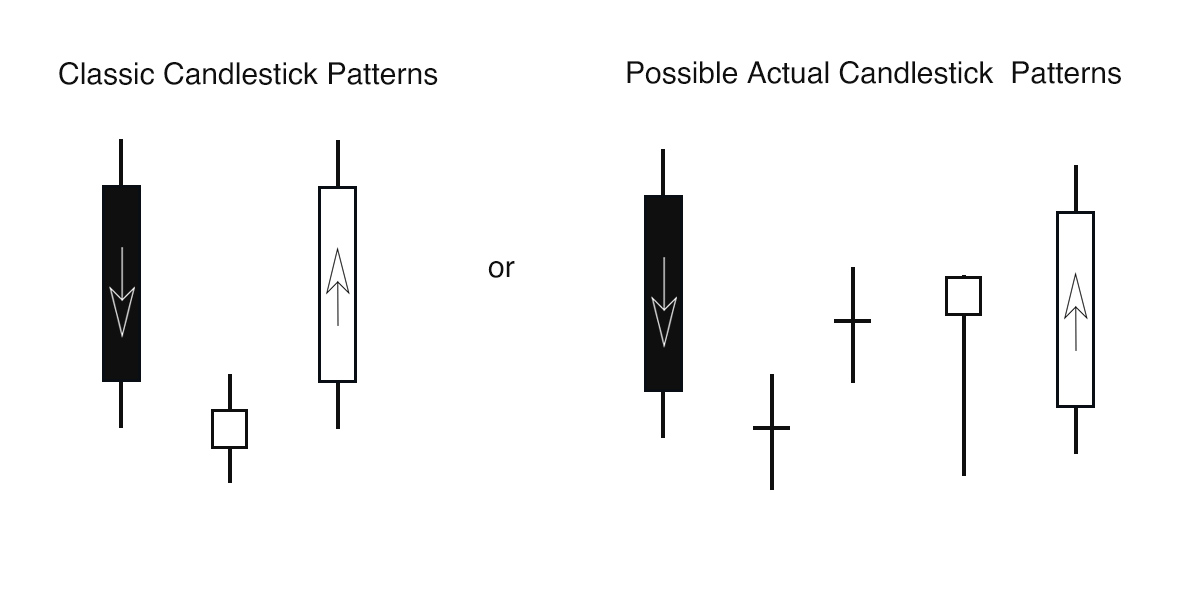
The image below shows the candlestick pattern of the Morning Star. It’s important to note the structure of the Morning Star, which begins with a decisive bearish candlestick line, followed by one or more hesitant candlestick lines, and finally, a decisive bullish candlestick line.
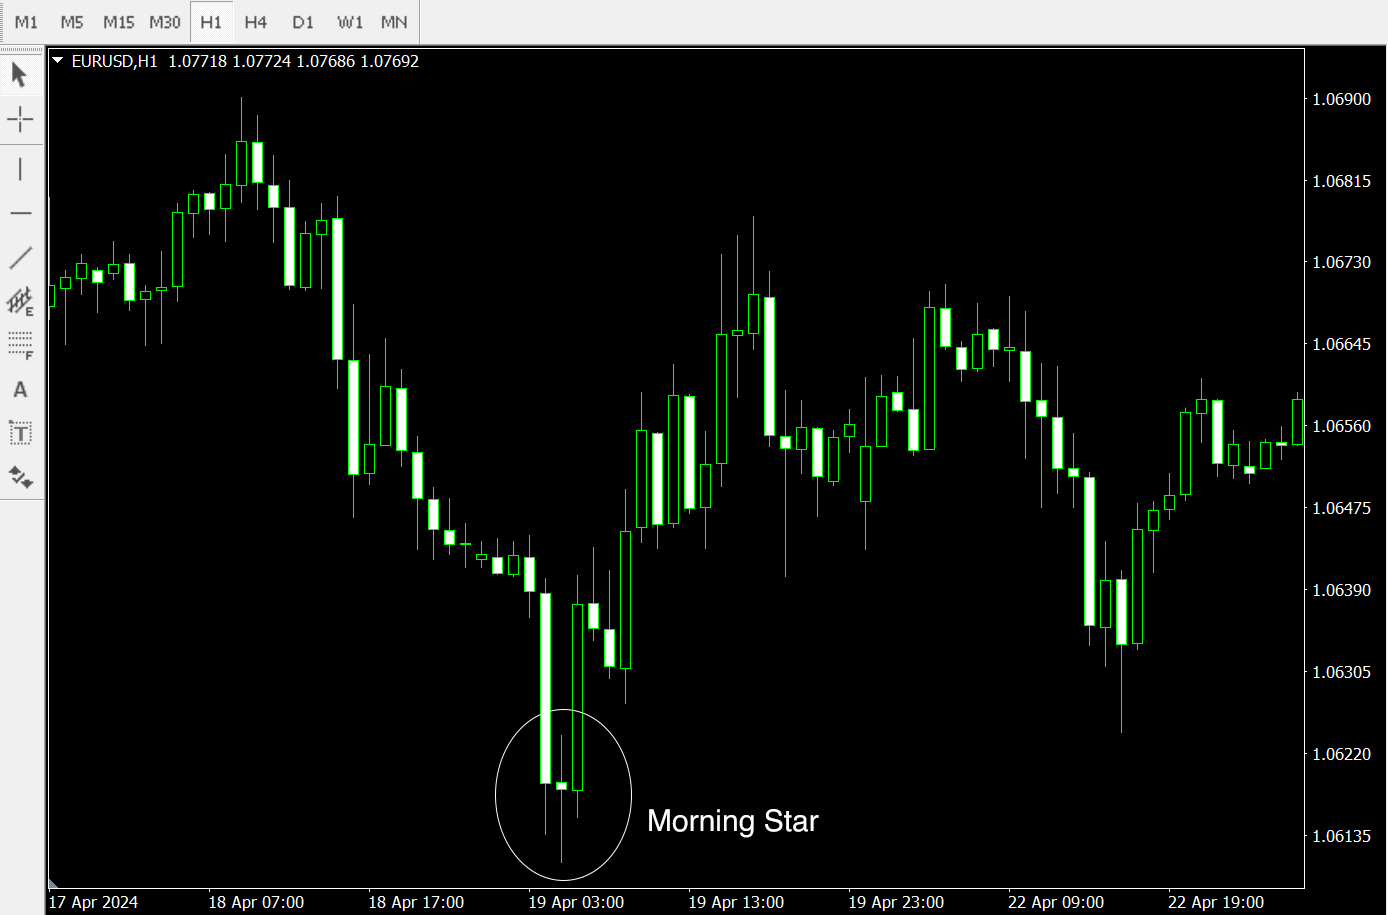
In the figure below, the Morning Star appears at the bottom, indicating that the recent downtrend may have ended. The Morning Star starts with a decisive large bearish candlestick line, followed by one or more hesitant candlestick lines, and immediately after, a decisive bullish candlestick line. This bullish line’s closing price is above 60% of the initial large bearish candle’s body, or even surpasses it.
The Morning Star indicates a U-shaped reversal in the forex market. If the closing price of the large bullish candle at the end is below 50% of the aforementioned large bearish candle’s body, then it signals a continuation of bearish sentiment. The Morning Star is a bullish pattern, suggesting the formation of a potential bottom or reversal. The Morning Star can have various actual appearances, with the number of candlestick lines possibly exceeding three.
Market Psychology of the Morning Star
The Morning Star signifies that the bears have lost control of the market. Investors stop selling, and more buyers enter the market, leading to a balance of power between buyers and sellers. Eventually, as more buyers continue to enter, the bulls gain control of the forex market. The bearish force weakens, and the bulls take full command of the situation. The large bullish candle in the Morning Star pattern causes a ripple effect in the market, initiating a significant upward surge, especially when there is a noticeable increase in trading volume.
XII. Bullish Engulfing (Buy Signal)
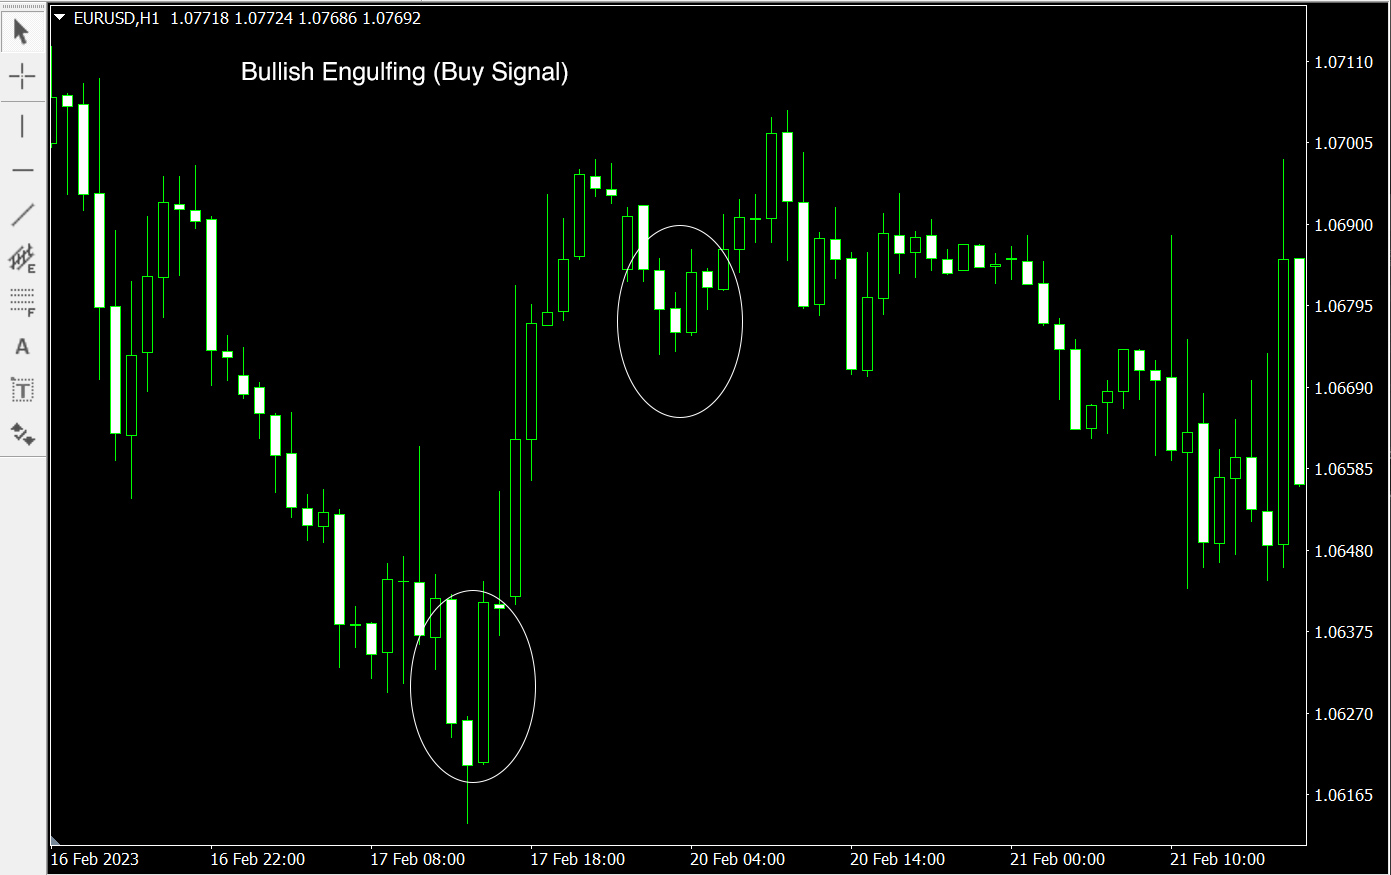
The Bullish Engulfing pattern typically signifies the end or reversal of a downtrend, or it may indicate a pivot or end of a downward retracement in an uptrend (see the figure below).
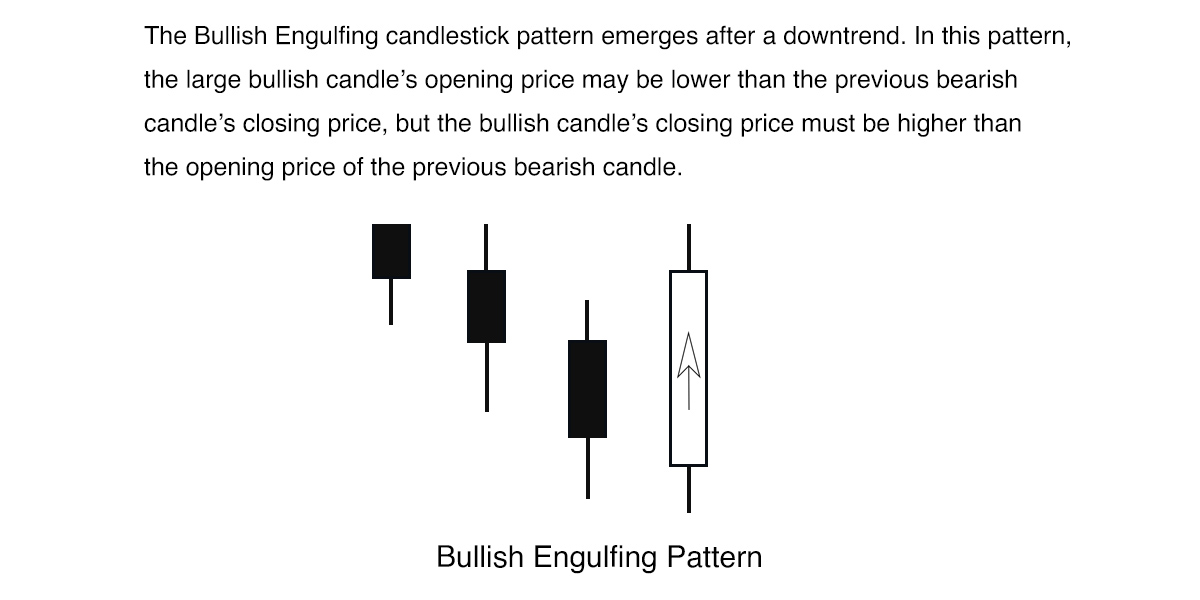
The classic composition of a Bullish Engulfing pattern is a bullish candle whose opening price is below the closing price of the previous bearish candle, engulfing the bodies of the previous two or three bearish candles. This is a strong signal of a U-shaped reversal, with the bulls completely taking control of the market (see the figure below).
Market Psychology of Bullish Engulfing
The bearish force is exhausted, and bullish power accumulates. Traders holding short positions close out their positions during the rapid decline, accelerating the formation of this pattern. The trading volume data during the upward movement indicates that, during this period, most traders have shifted from a bearish to a bullish stance.
XIII. Tweezer Bottom (Buy Signal)
The formation of a Tweezer Bottom indicates that the bears have lost control of the market. Buyers enter the market, leading to a balance of power between the bulls and bears. This is represented on the chart by two or more hesitant candlestick lines (see the figure below).
Tweezer Bottoms: Indicating Potential Bottoms or Reversals A Tweezer Bottom is formed by two or more candlestick lines and can consist of either bullish or bearish candles. The low points of the candlestick lines are the same or close to each other. The minimum length of the lower shadow should be at least 60% of the total fluctuation range of the candlestick.
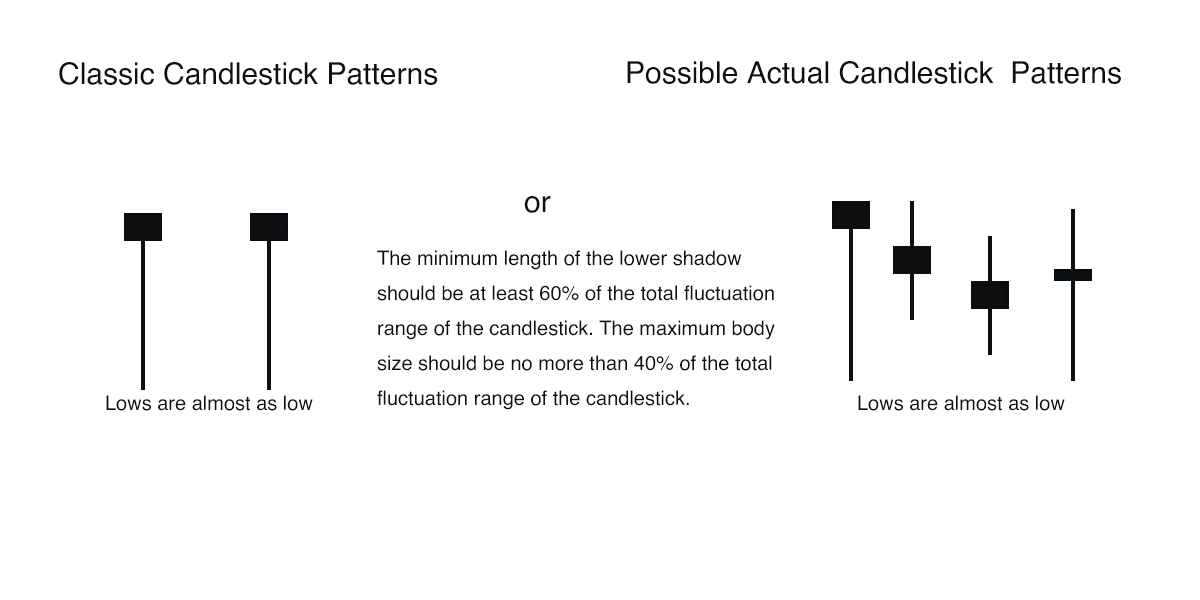
Market Dynamics and the Formation of Tweezer Bottoms The market continues to decline, but the bulls are determined to actively intervene, leading to the formation of a Tweezer Bottom. Previously, the market was in a consistent downtrend, marked by bearish candles. Suddenly, hesitant candlestick lines form, indicating that more bulls are starting to buy. The power between the bulls and bears reaches equilibrium. The Tweezer Bottom begins with a decisive bearish candle, followed by one or more hesitant candlestick lines (as seen in the previous figure).
The figure below shows that as the bears try to push the price further down, the bulls enter the market, and their strength begins to outweigh that of the bears, forming a candlestick line with a long lower shadow and a small body. During the bears’ second attempt to lower the price, the same result occurs, and another hesitant candlestick line forms, again with a long lower shadow and a small body. The low points of the two candlestick lines are often close, with only a few points difference, forming a new support level—the Tweezer Bottom. This marks the end of the downtrend, and the market is ready for an upswing. Anyone who wants to profit from the next upward wave should enter a long position immediately. Why? Because after the formation of the Tweezer Bottom, the market may reach higher levels. The figure below illustrates this scenario.
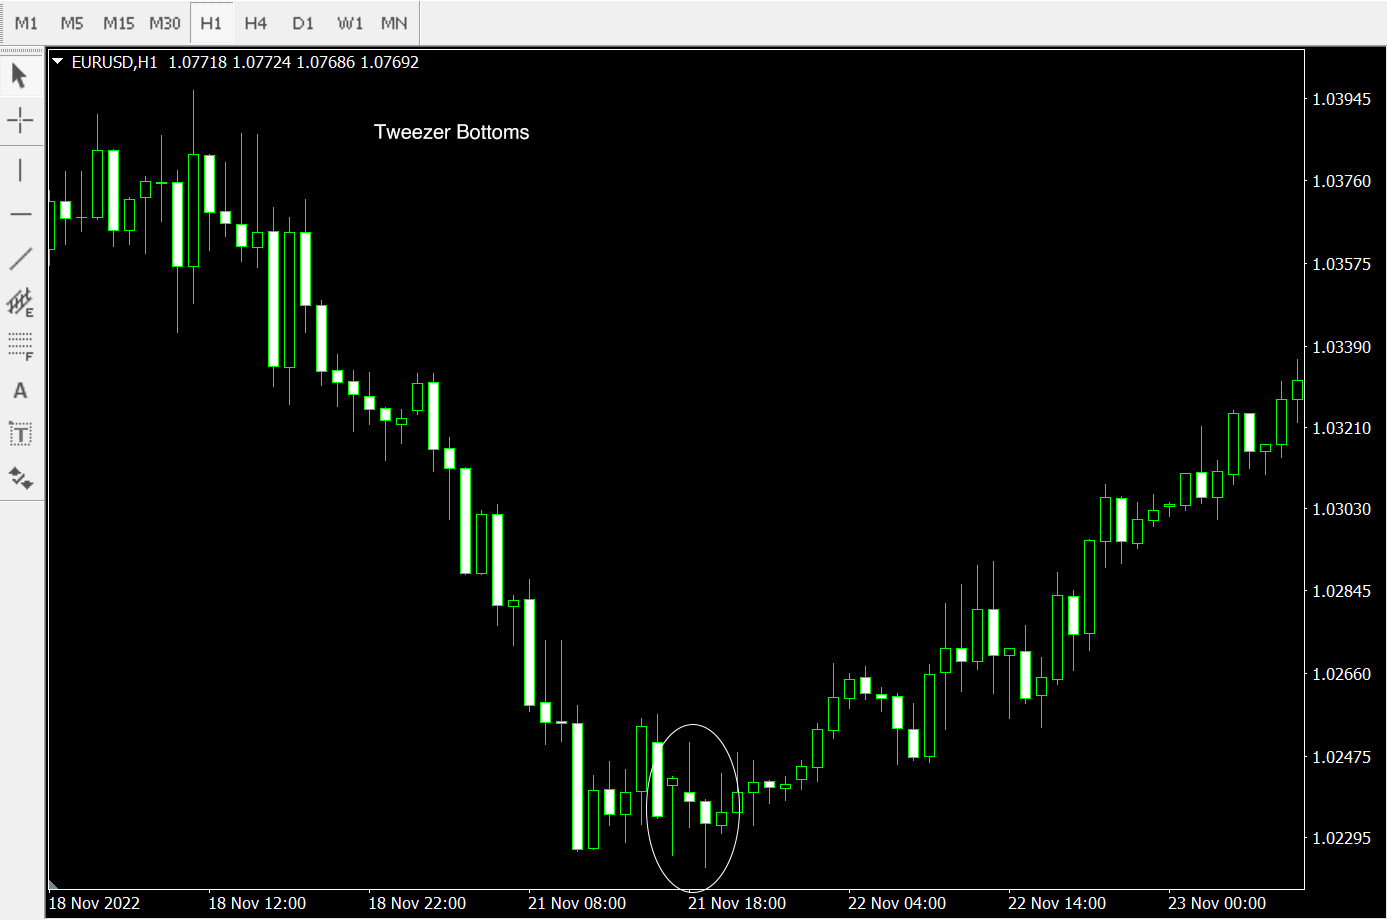
Market Psychology of Tweezer Bottoms
The bears have reached a new low, which, after being tested, attracts new buyers into the market. As investors’ bullish expectations strengthen, the market is also expected to rise. No additional bears enter the market, nor do they have the strength to push prices lower. Such attempts have been made several times but have all ended in failure, as indicated by the long lower shadows and small bodies of the candles. The Tweezer Bottom is a signal of selling pressure exhaustion. It is important to note that the candlestick lines forming the Tweezer Bottom pattern may not be consecutive, but as long as the lows are close to each other, usually differing by only a few points, the Tweezer Bottom will become a support level.
XIV. Bearish Candlestick Patterns or Sell Signals in Forex Trading
The main bearish candlestick patterns are:
- Evening Star
- Bearish Engulfing
- Tweezer Top
These candlestick patterns can appear in both downtrends and uptrends. However, their value is exceptional when they appear in a downtrend and are followed by a short position, offering significant gains. That is to say, if these patterns appear at the end of an uptrend within a shorter time frame — which is merely a retracement in a longer-term downtrend — their significance is substantial.
It’s important to note that sometimes the forex market may move sideways within a 20 to 40 point range, possibly forming various bullish and bearish candlestick patterns. These patterns should be ignored, and you should not trade based on these candlestick patterns during such minor fluctuations and sideways movements.
XV. Evening Star (Sell Signal)
The figure below illustrates the candlestick pattern of the Evening Star. It’s important to note the structure of the Evening Star, which begins with a decisive bullish candlestick line, followed by one or more hesitant candlestick lines, and finally, a decisive bearish candlestick line.
The Evening Star is a bearish pattern that suggests the formation of a potential top or reversal. The Evening Star can have various actual appearances, with the number of candlestick lines possibly exceeding three.
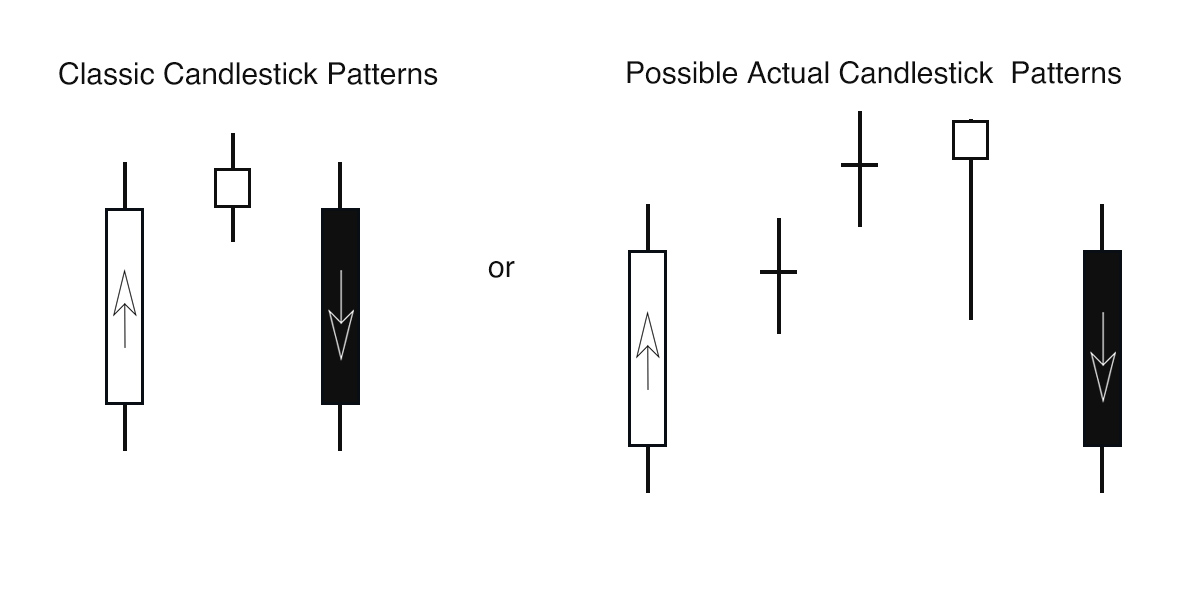
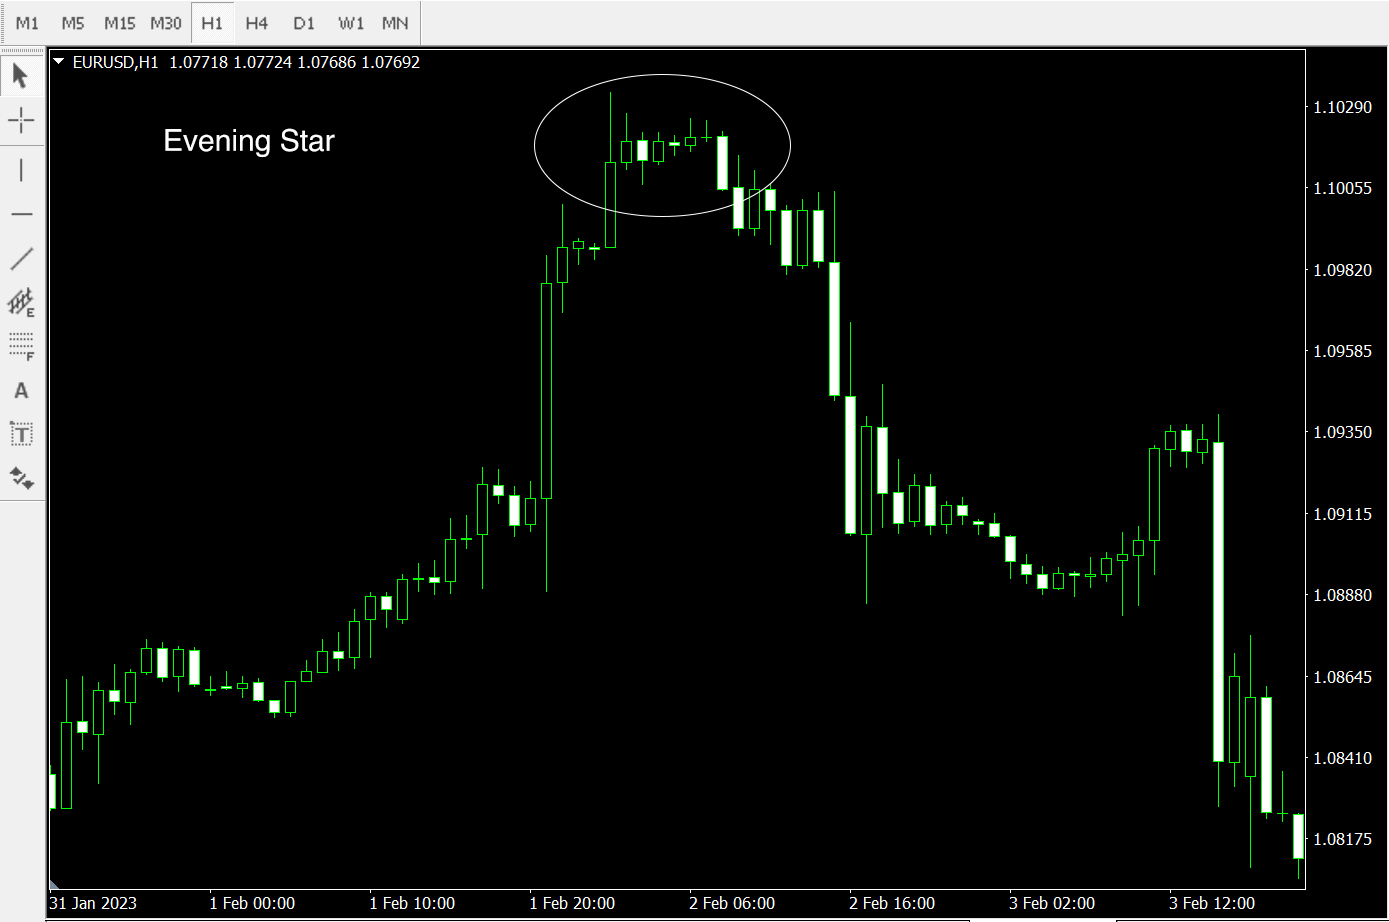
In the figure below, the Evening Star appears at the top, suggesting that the recent uptrend may have ended. The Evening Star begins with a decisive large bullish candlestick line, followed by one or more hesitant candlestick lines, and then a decisive bearish candlestick line. The closing price of this bearish line is below 60% of the initial large bullish candle’s body, or it surpasses the bullish candle’s body. The Evening Star indicates a U-shaped reversal in the market. If the closing price of the large bearish candle at the end is above 50% of the aforementioned large bullish candle’s body, then it signals a continuation of the bullish trend.
Market Psychology of the Evening Star
In the figure below, the bulls push the price continuously higher, like a rocket heading straight for the moon, seemingly unstoppable, and the initial bullish candle further reinforces this bullish sentiment. Suddenly, a spindle line appears at a high level, which is a hesitant candlestick line, showing increased market uncertainty. Soon after, a decisive bearish candle appears, indicating a rapid change in market sentiment and a U-shaped reversal. The bulls lose control of the market, investors stop buying, and more sellers enter the market, leading to a balance of power between buyers and sellers. Eventually, as more sellers continue to enter, the bears gain control of the market. The bullish force weakens, and the bears take full command of the situation. The large bearish candle in the Evening Star pattern causes a ripple effect in the market, initiating a significant downward trend, especially when there is a noticeable increase in trading volume.
XVI. Bearish Engulfing (Sell Signal)
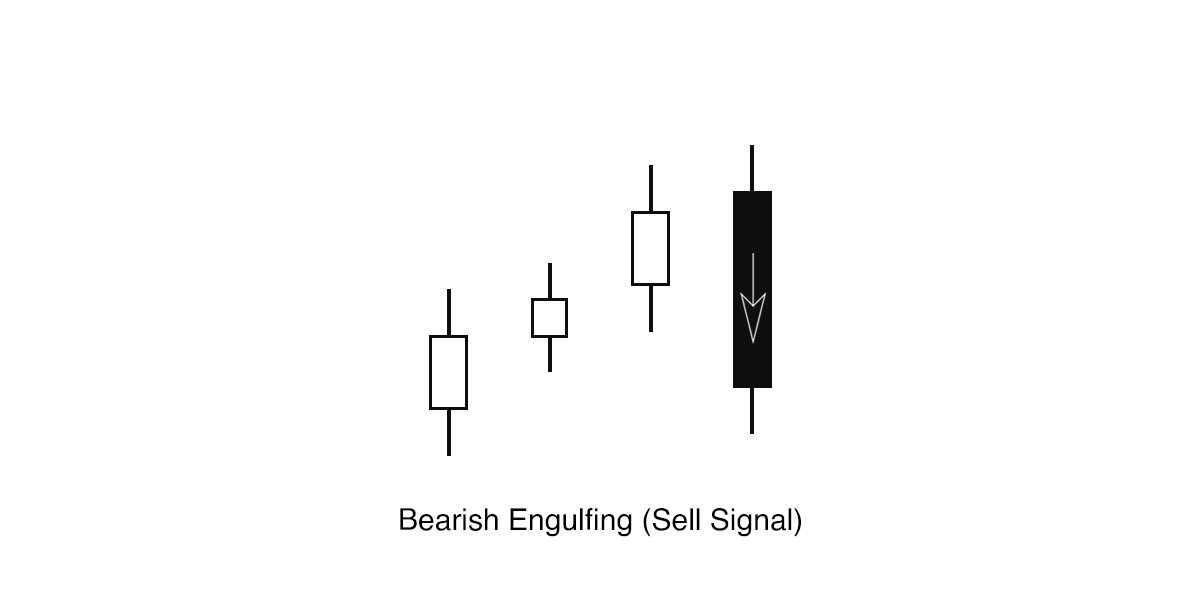
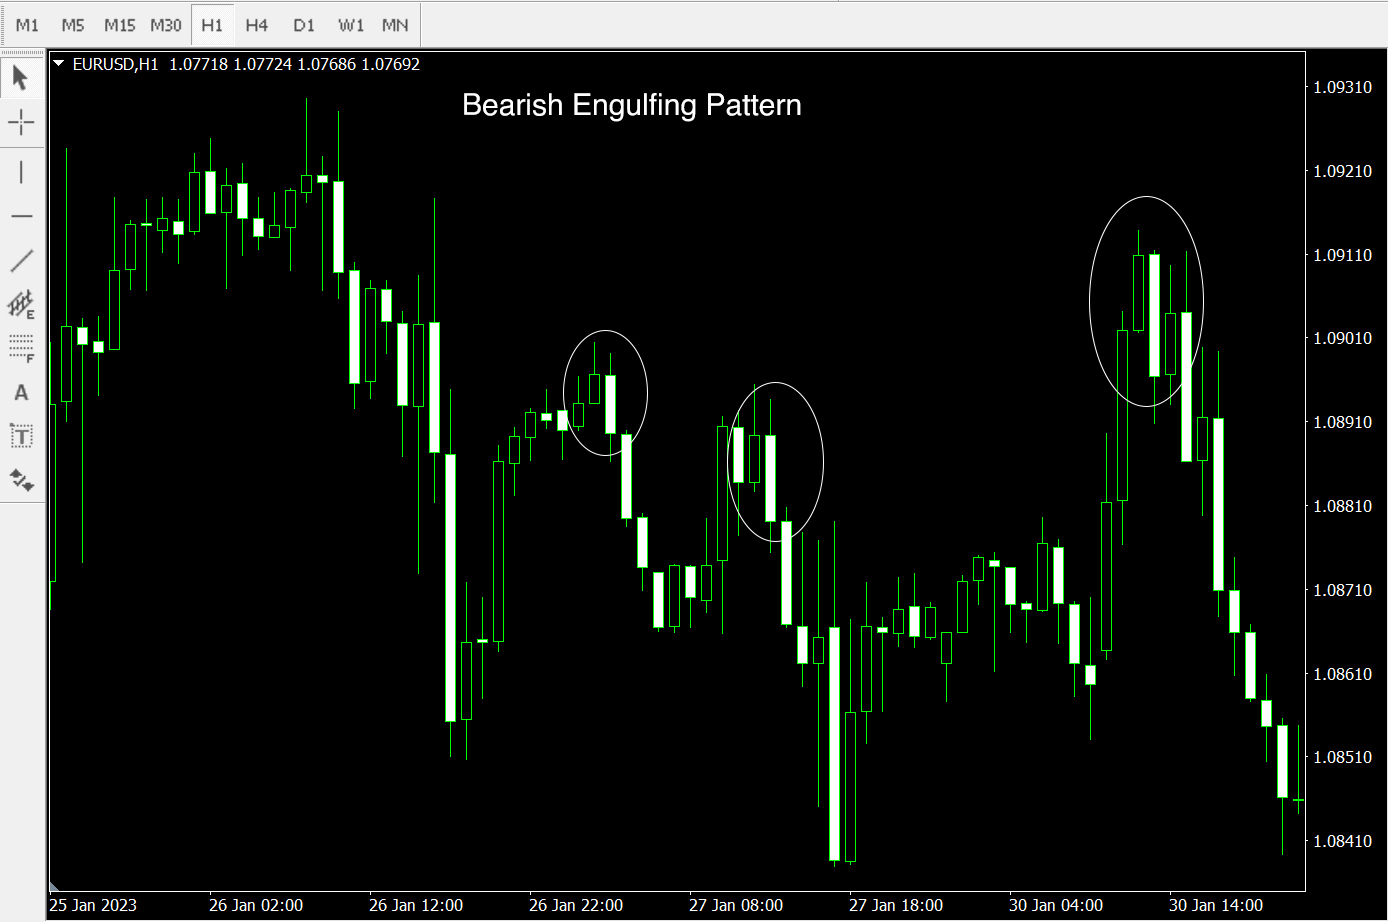
The Bearish Engulfing pattern typically signifies the end or reversal of an uptrend, or it may indicate a pivot or end of an upward retracement in a downtrend (see the figure below). The price continues to rise, with several small decisive bullish candles appearing, followed by a sudden large bearish candle that engulfs the previous bullish candles (see the second figure below). The classic composition of a Bearish Engulfing pattern is a bearish candle whose opening price is higher than the closing price of the previous bullish candle, completely engulfing the bodies of the previous bullish candles. This is a strong signal of a U-shaped reversal, with the bears completely taking control of the forex market.
The Bearish Engulfing candlestick pattern emerges after an uptrend. In this pattern, the large bearish candle’s opening price may be higher than the previous bullish candle’s closing price, but the bearish candle’s closing price must be lower than the opening price of the previous bullish candle.
Market Psychology of Bearish Engulfing
From a market psychology perspective, once a Bearish Engulfing pattern appears, it serves as a swift and advantageous blow to the bulls. Traders who were confident in the uptrend will be devastated. Previously, traders holding long positions would close out their positions during the rapid ascent, which also accelerated the formation of this pattern. The trading volume data during the downward trend indicates that, during this period, most traders have shifted from a bullish to a bearish orientation.
XVII. Tweezer Top (Sell Signal)
The formation of a Tweezer Top indicates that the bulls have lost control of the market. Sellers enter the market, leading to a balance of power between the bulls and bears, which is depicted on the chart as two or more hesitant candlestick lines (see the figure below).
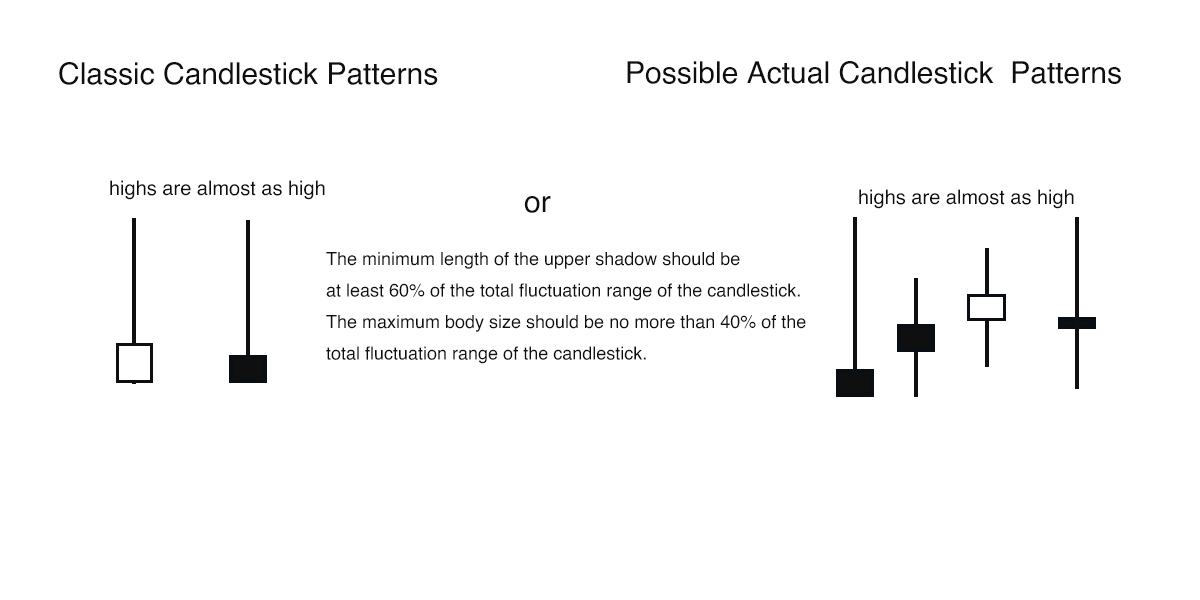
A Tweezer Top suggests the formation of a potential top or reversal. It may consist of two or more candlestick lines, which can be bullish or bearish. The high points of the candlestick lines are the same or close to each other, with the minimum length of the upper shadow being at least 60% of the total fluctuation range of the candlestick.
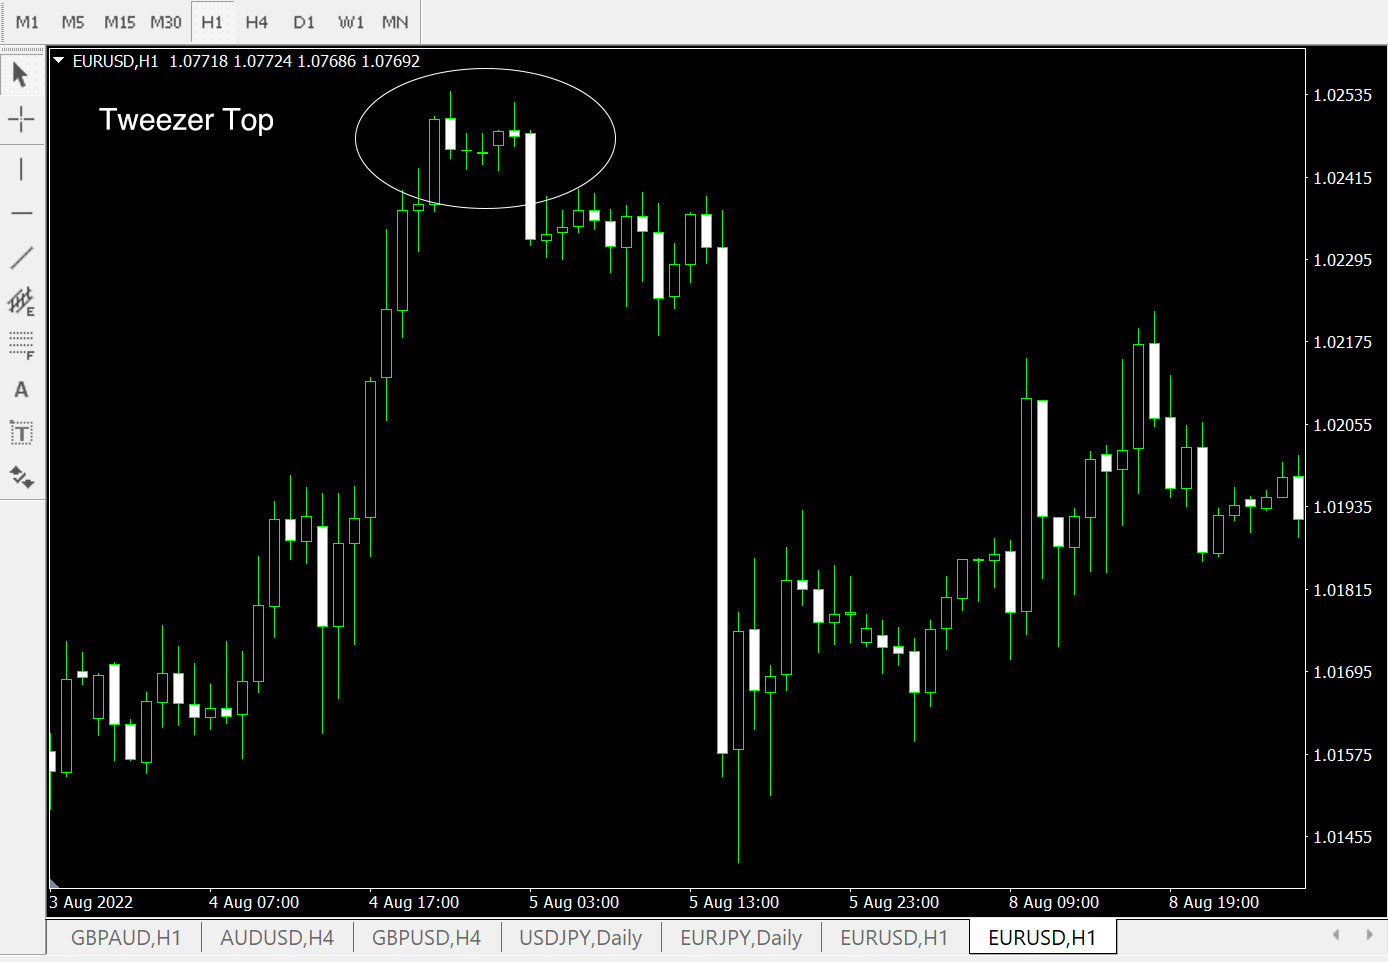
The figure below shows that the forex market continues to rise, but a clear large bearish candle suddenly appears, forming a Tweezer Top. Previously, the market was consistently rising, marked by bullish candles. Suddenly, hesitant candlestick lines form, indicating that more bears are starting to sell. The power between the bulls and bears reaches equilibrium. The Tweezer Top starts with a decisive bullish candle, followed by one or more hesitant candlestick lines (as seen in the previous figure).
The figure below shows that as the bulls try to push the price further up, the bears enter the forex market, and their strength begins to outweigh that of the bulls, forming a candlestick line with a long upper shadow and a small body. During the bulls’ second attempt to raise the price, the same result occurs, and another hesitant candlestick line forms, again with a long upper shadow and a small body. The high points of the two candlestick lines are often the same, with only a few points difference, forming a new resistance level—the Tweezer Top. This marks the end of the uptrend, and the market is ready for a downturn. Anyone who wants to profit from the next downward wave should enter a short position immediately. Why? Because after the formation of the Tweezer Top, the market may reach lower levels. The figure below illustrates this scenario.
Market Psychology of Tweezer Tops
The bulls have reached new highs, and after these highs are tested, more sellers enter the market. One hesitant candlestick line after another forms, with a series of three appearing in Figure 4-16. Under this resistance pressure, the market begins to collapse. As investors’ bearish expectations strengthen, the market is also expected to decline. After a period of decline, the bulls do not give up, attempting to attract more buying to support the market, but their efforts fail, sending further bearish signals. “The strength of the bulls is no longer sufficient to push prices higher—everyone, sell.” The bullish force is exhausted, and the bears take control of the market. It is important to note that the candlestick lines forming the Tweezer Top pattern may not be consecutive.
XVIII. Trading Candlestick Patterns in Forex Trading
Mastering the recognition and trading techniques of candlestick patterns is essential to identify potential future patterns. However, even though these patterns provide good trading signals as shown in the figure below, you should not enter trades based solely on these patterns; you need to combine them with some common sense.
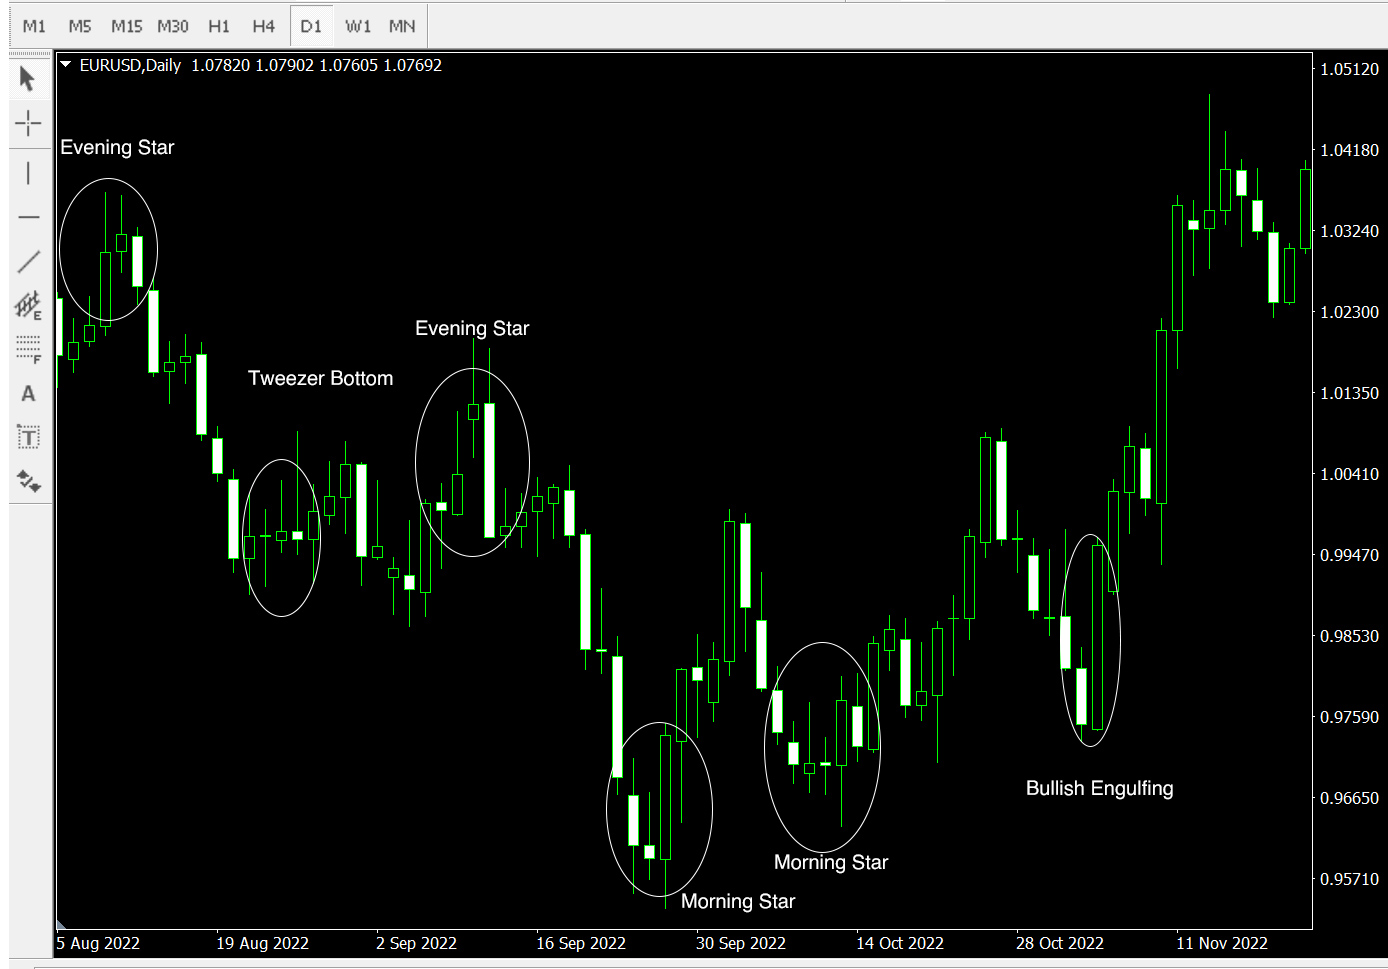
Common sense dictates that if the market is in a downtrend, you should only use bearish candlestick patterns to short and not use bullish patterns to go long. Why? Because you should follow the downtrend where the bears have the advantage. After you enter a short position instead of a long one, the market is more likely to continue falling. Obviously, you would do the opposite in an uptrend. When you trade in the direction of the trend, market fluctuations tend to be more favorable to you because they are more likely to follow the established direction.
When trading with candlestick patterns, you must wait for the last candlestick that forms the pattern to close before entering the trade, as the market may not react immediately when the pattern is formed. Remember, as long as you have set a stop loss, you are in a protected position. The forex market operates by its own rules—not yours. You cannot control the future movement of the market, and no one knows where the market will go next.
As long as the candlestick is above the medium-term uptrend line, you should enter a long position based on bullish candlestick patterns and exit based on bearish patterns; in a downtrend, do the opposite. That is, when the candlestick is below the medium-term downtrend line, short with bearish candlestick patterns and cover with bullish patterns (see the figure above).
Trading is a game of probabilities, and it’s about making the odds work in your favor to succeed. Generally speaking, integrating various pieces of information is more helpful in anticipating a U-shaped reversal in the market at your entry point in the direction of the trade. That is to say, if you have more than one reason to enter a trade, your chances of success increase. This is what’s known as the “confluence effect”—essentially, it’s all about finding reasons for the market to move in a certain direction at that point.
Why does the market suddenly form a candlestick pattern at a certain point and change direction, or form a U-shaped reversal? It seems like a conspiracy among a group of traders. We all know this explanation is impossible because there is no place where a large number of forex traders gather to manipulate exchange rates. My personal view is that nature maintains balance and has its own ways of doing so. As humans, we are part of nature, and because we are part of market trading, it is our buying and selling that drives the market. The market is part of nature and has its own ways of maintaining balance, which will be discussed in other articles on our website.
XIX. Summary of 18 Candlestick Patterns to Predict the Forex Market is Rising or Falling
I recall all the forex trading opportunities I missed over the past few years, when I was less educated in this area, or failed to see the signals provided by the forex market, such as the Evening Star and Morning Star. If becoming a successful forex trader is your true goal, you must be prepared to read the signals provided by the market. Only then can you achieve success.