I. Identifying an Uptrend in Forex Trading
In any time frame, if the forex market is moving upwards, it does so in waves, continually reaching higher highs and then pulling back to form higher lows. I have never seen a trend shoot straight to the moon like the Apollo spacecraft. Even if a trend is headed to the moon, it will advance in waves, constantly creating higher highs and higher lows.
A trend will end at some point, but until then, most successful traders will trade with the trend until it ends or reverses. Believe it or not, most traders make their profits during trends and lose it all during market fluctuations.
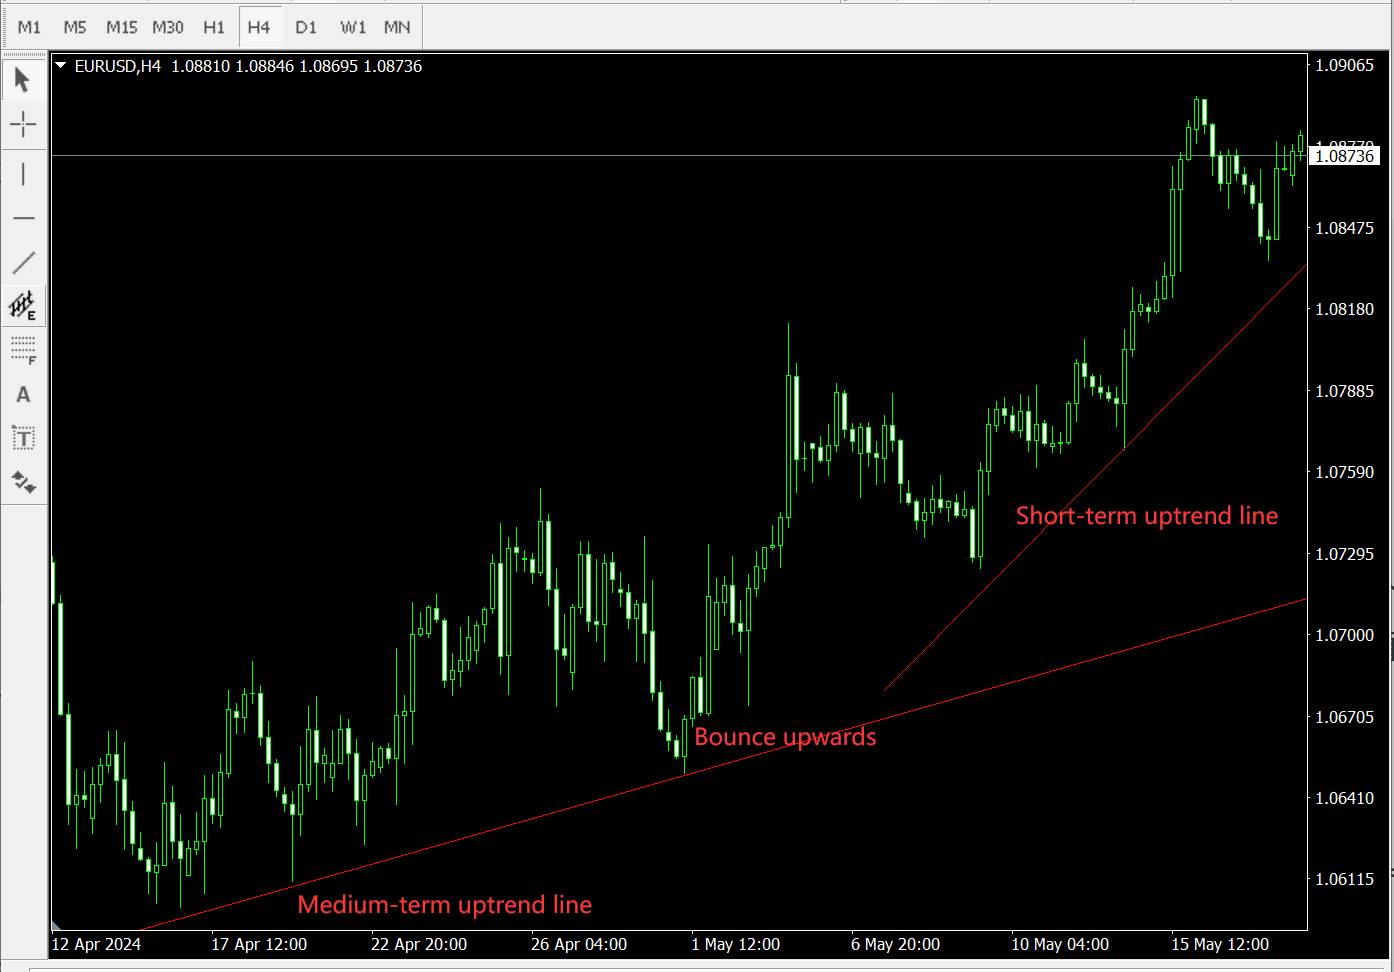
Regardless of the direction the market moves, it does so at varying speeds, much like a car. The normal angle of a healthy trend is 45 degrees. A trend line running at a 45-degree angle is called a medium-term trend line. Trend lines below this angle are referred to as long-term trend lines.
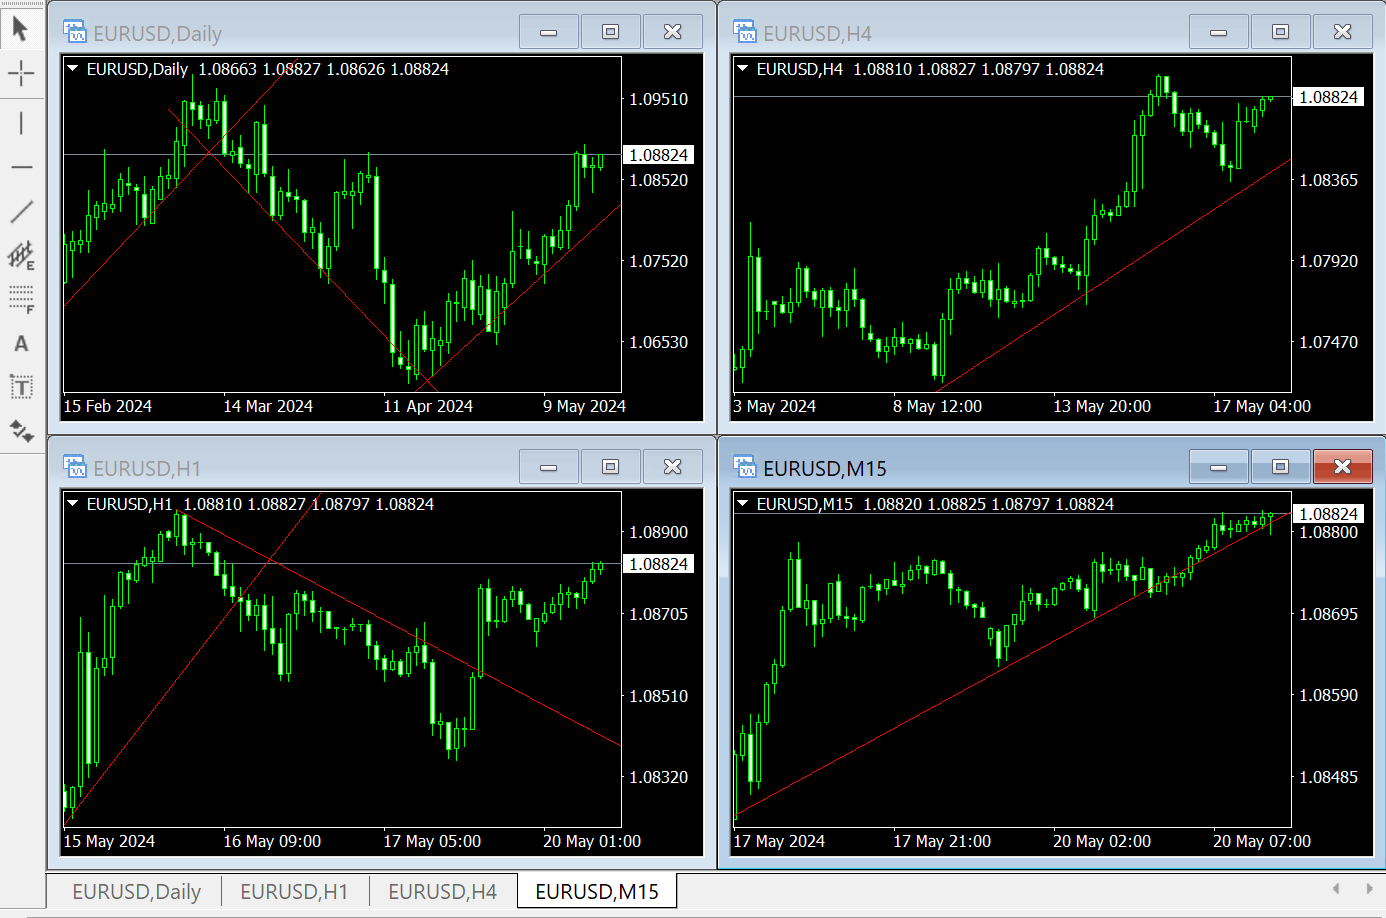
Sometimes, trends accelerate upwards at an angle greater than 45 degrees, creating a more intense trend, forming short-term trend lines. Whether in an uptrend or downtrend, and regardless of the time frame, long, medium, and short-term trends evolve simultaneously (see the chart below).
II. Drawing an Uptrend Line in Forex Trading
By connecting valid support points with a straight line, without cutting through the body or the lower shadow of the candlesticks, you can draw an uptrend line (see the chart below). I find that connecting the low points of the candlestick shadows rather than the low points of the candlestick bodies results in a more accurate uptrend line, allowing traders to better predict the exact position of future rebounds (see the chart below).
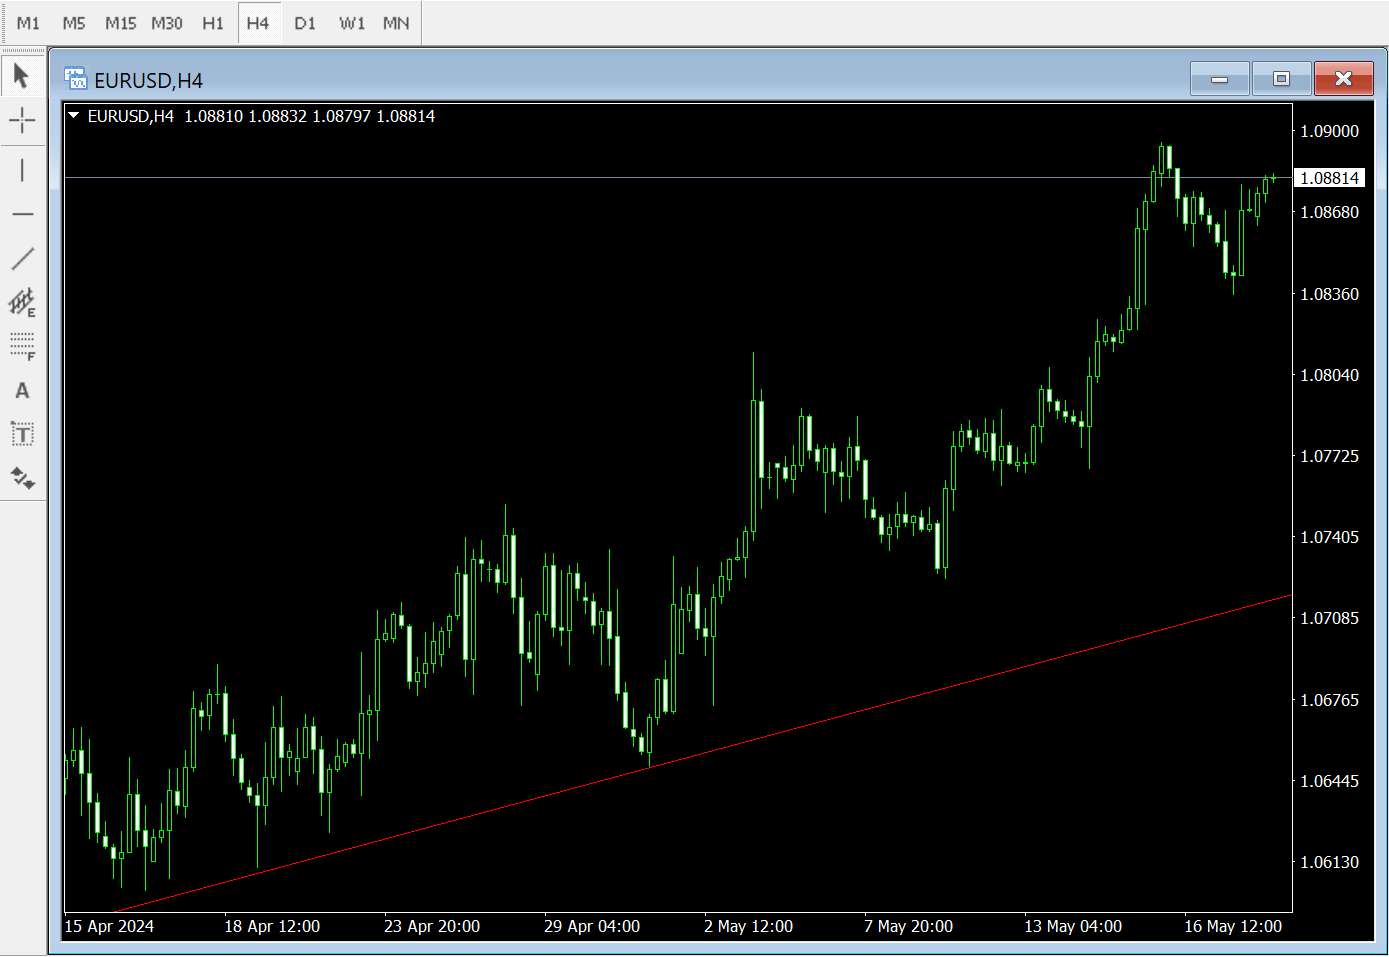
When the forex market touches the trend line, something wonderful happens. Most traders call it a miracle. The market is like a great river, sometimes raging, sometimes calm. The market can move in any direction at any time, but it is also governed by a series of natural laws, just as rivers are influenced by gravity and the obstacles they flow past.
On one hand, the market moves in a certain direction, and on the other, there is a tendency to revert back to the trend line. If the current trend is to continue, once it pulls back to the trend line, the market will bounce upwards in the direction of the previous trend. Here, the trend line acts as a barrier to downward movement, changing the short-term downward direction. In other words, correctly drawing the trend line can predict potential support levels in an uptrend and potential resistance levels in a downtrend.
III. Finding and Drawing Short-Term, Medium-Term, and Long-Term Uptrend Lines in Forex Trading
To draw a short-term uptrend line, connect the two nearest support points from left to right. Starting from the far left of the chart, draw a straight line connecting the main support points to create a medium-term uptrend line.
In other words, starting from the left side of the chart, identify the lowest point, then find the next higher support point, and draw a straight line upwards at about a 45-degree angle. Connect two low points to form a line, without cutting through any candles.
As long as the chart continues to make higher highs and higher lows, your trend line should remain below the lows (see the chart below).
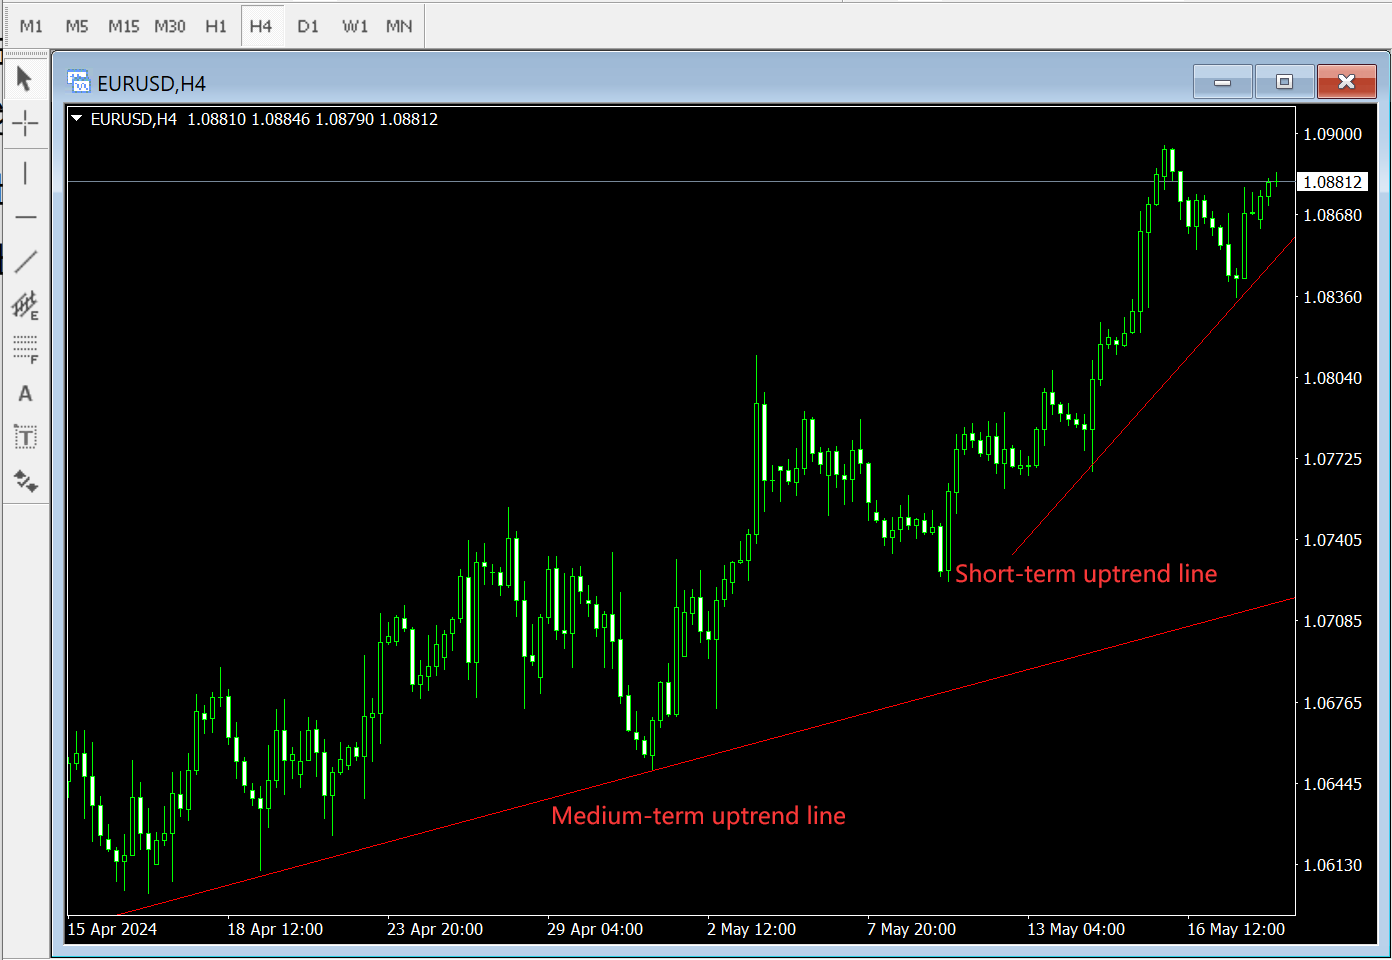
To draw a long-term trend line, you can zoom out on the chart or switch to a longer time frame, then start from the far left of the chart and connect your support points all the way to the right. Short-term and medium-term trend lines appear in all time frames; a short-term trend line drawn on a daily chart represents the uptrend of the last few days, while a medium-term trend line represents the uptrend of the last few months.
On an hourly chart, a short-term trend line represents the uptrend of the last few hours, while a medium-term trend line represents the uptrend of the last few days. It’s best to frequently zoom out on the time frame you are viewing to discover other medium-term or long-term trend lines.
Successful forex traders always monitor all uptrend lines across all time frames. Why? Because the trends in shorter time frames are always influenced by trend lines in longer time frames.
This means that if the forex market retraces to an uptrend line on the daily chart, what appears as a 200-point retracement on the daily chart could be a downtrend on the 60-minute chart.
If you only analyze the 60-minute chart, you might see a strong downtrend and be inclined to go short. However, as Murphy’s Law would have it, you might enter at the tail end of the downtrend on the 60-minute chart, and once the market touches the uptrend line on the daily chart, the 60-minute chart will reverse upwards and start to accelerate, leaving you scratching your head, wondering what went wrong.
Once again, short-term, medium-term, and long-term uptrend lines can be found on any chart and in any time frame. The medium-term trend line indicates the overall forex market trend on that time frame’s chart, while the short-term trend line indicates the recent market trend.
As long as the market moves above the medium-term uptrend line, there is an 80% chance that the market will maintain a bullish trend.
Remember, uptrend lines are potential support levels. They act like a floor, and when the market touches them, it tends to bounce upwards. If the short-term trend line is breached, the market usually moves towards the medium-term trend line and bounces there. If the medium-term trend line is breached, in most cases, the market will move towards the long-term trend line and bounce there. If the long-term trend line is breached, a major trend reversal usually occurs (see the chart below).
IV. The Incorrect Way to Draw Uptrend Lines in Forex Trading
Drawing the correct trend lines is crucial for your success and can help minimize financial losses.
On a trip to South Africa, I flew to Cape Town to meet Mr. Joubert, whose trading firm was struggling due to their trades not covering expenses.
When I first entered their trading room, all I could see on the screens were incorrectly drawn trend lines.
As I continued to walk around the trading room, seeing different forex trading systems on the screens, I wondered what made them so self-assured.
Suddenly, a trader shouted, “The Swiss Franc is about to touch an uptrend line, get ready to trade!” I walked over and found that he, like the others, had drawn the uptrend line incorrectly.
I said, “Short the Swiss Franc.” Everyone in the trading room stared at me as if I were crazy.
He said, “The Swiss Franc is about to touch an uptrend line, why would you want to short it? It’s still in an uptrend and about to hit a support level.”
I calmly replied, “The uptrend of the Swiss Franc has ended. It’s not about to touch an uptrend line; it has already broken through the short-term and medium-term uptrend lines and is now approaching the long-term uptrend line, which is about 150 points away. If it were up to me, I would short the Swiss Franc.”
He asked, “What are short-term, medium-term, and long-term trend lines?”
I answered, “That’s exactly why I’m here.”
He said, “Well, I’m going to go long anyway.”
I looked at everyone and said, “Let’s see who is right and who is wrong.” I told the traders, “From what I see on your screens, you’ve drawn the trend lines incorrectly. But if you believe in the uptrend lines you’ve drawn, then go ahead and trade, go long, I understand.”
Then I said, “Anyone who wants to get green pips on the Swiss Franc can short it, aiming for a profit of 125-150 points, and after closing the short position, go long with the new major uptrend.”
I held my breath and walked into Mr. Joubert’s office, knowing clearly that market trends are objective, but still hoping the market would continue to fall as I predicted. Fortunately, the Swiss Franc did fall 150 points to the bottom long-term uptrend line and bounced back like a basketball hitting the ground.
To profit from trading, you must draw the correct trend lines. This simple technique can help you learn when to enter the market and exit in time when the market turns, preserving your capital.
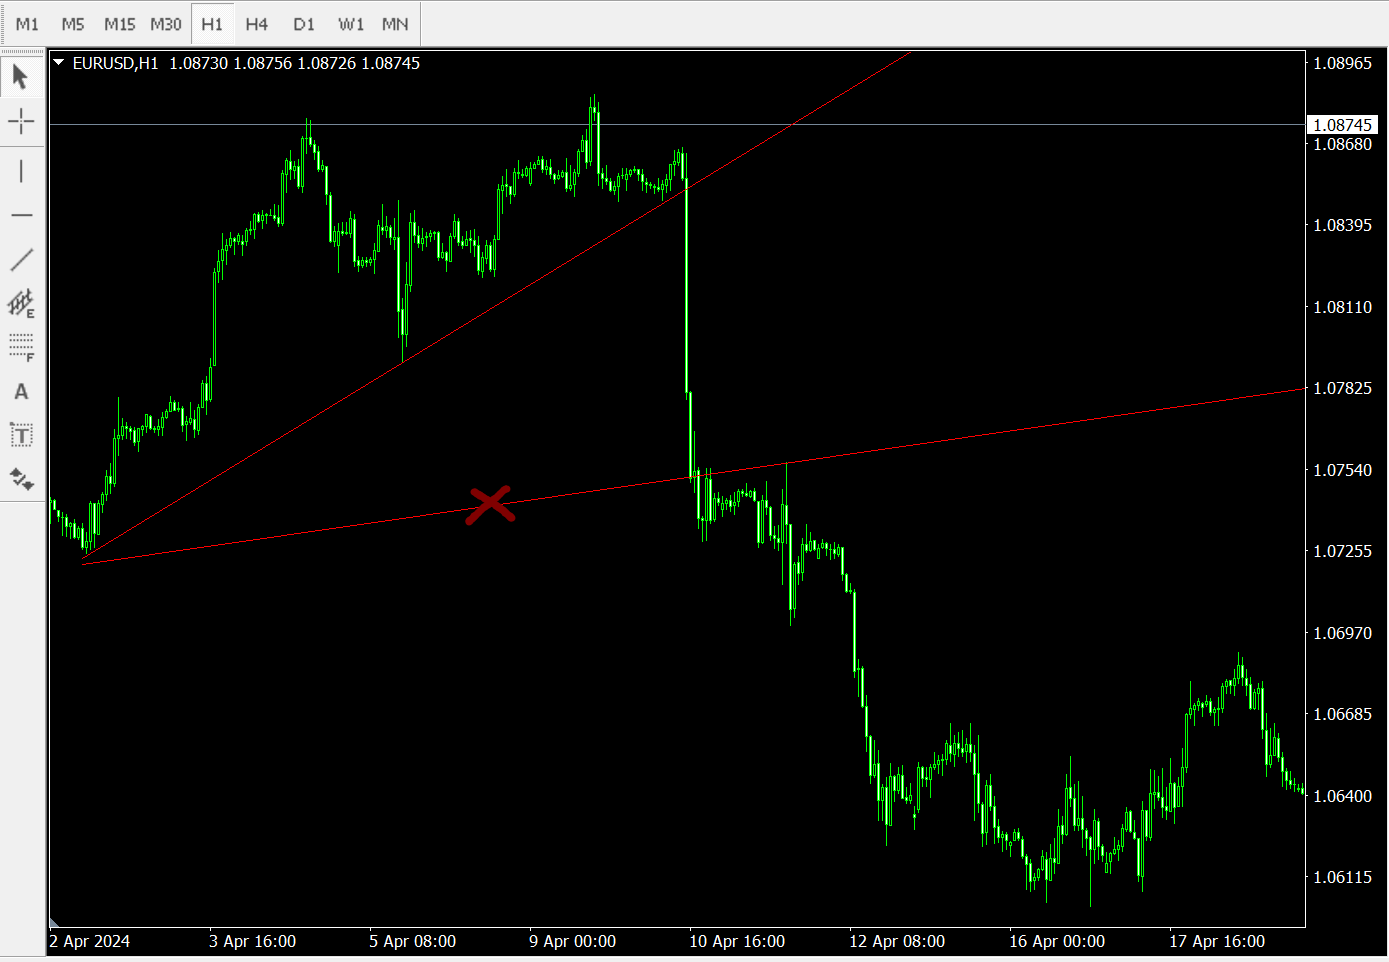
The chart below shows the incorrect way to draw an uptrend line. The mistake is that the uptrend line was drawn cutting through the body of the candles, whereas the correct method should be connecting the lower shadows of the candles.
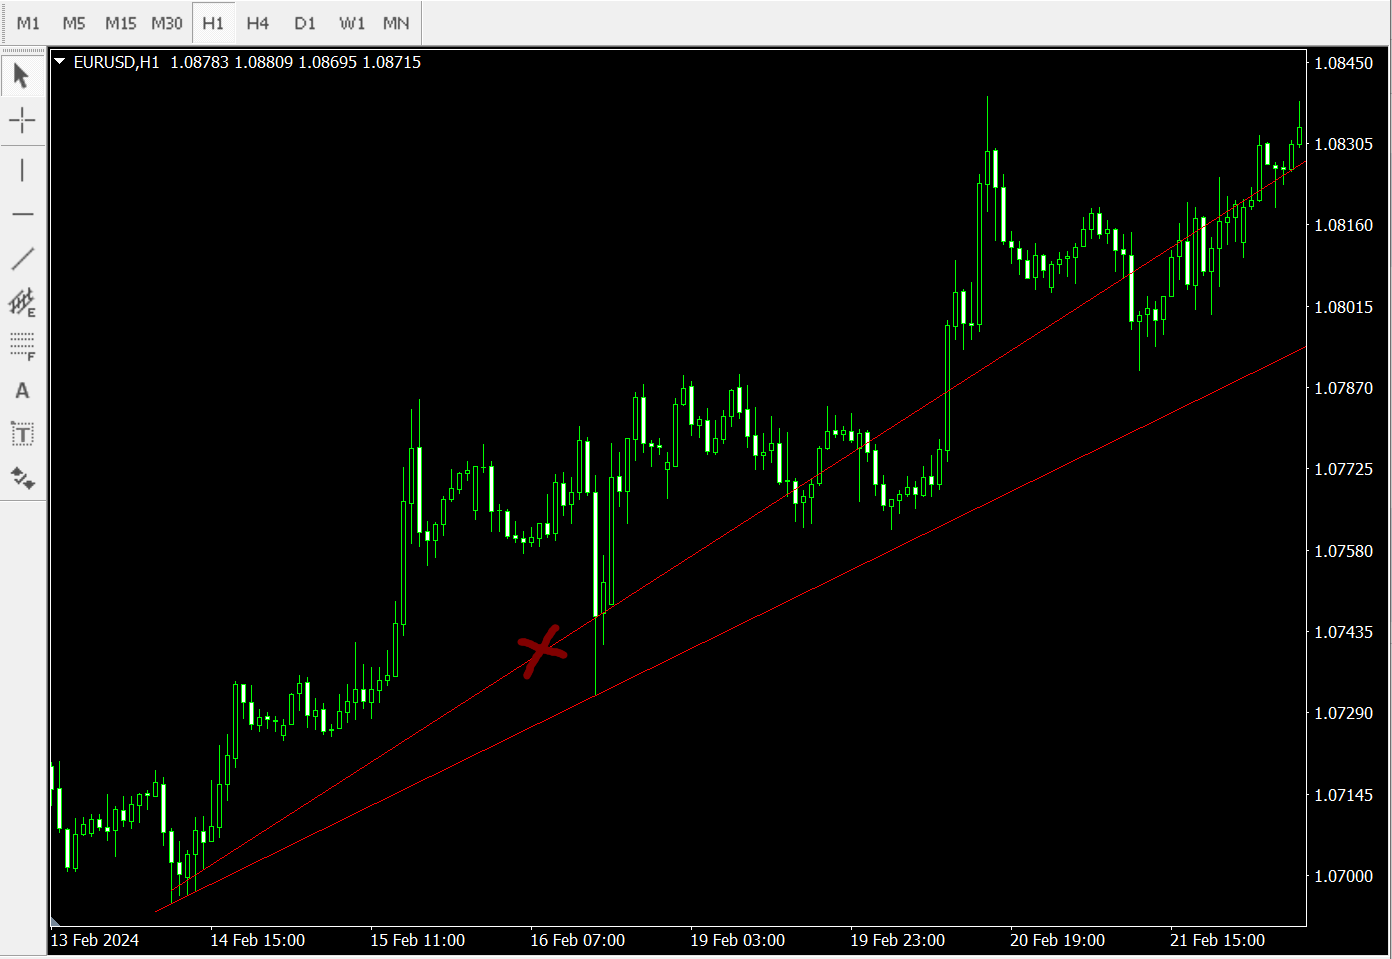
In the chart below, the line was once the correct uptrend line, and the forex market retraced downwards after breaking through this trend line before resuming the uptrend. As long as the market continues to make higher highs and higher lows, the trend lines should not cut through the candles but connect the lows below.
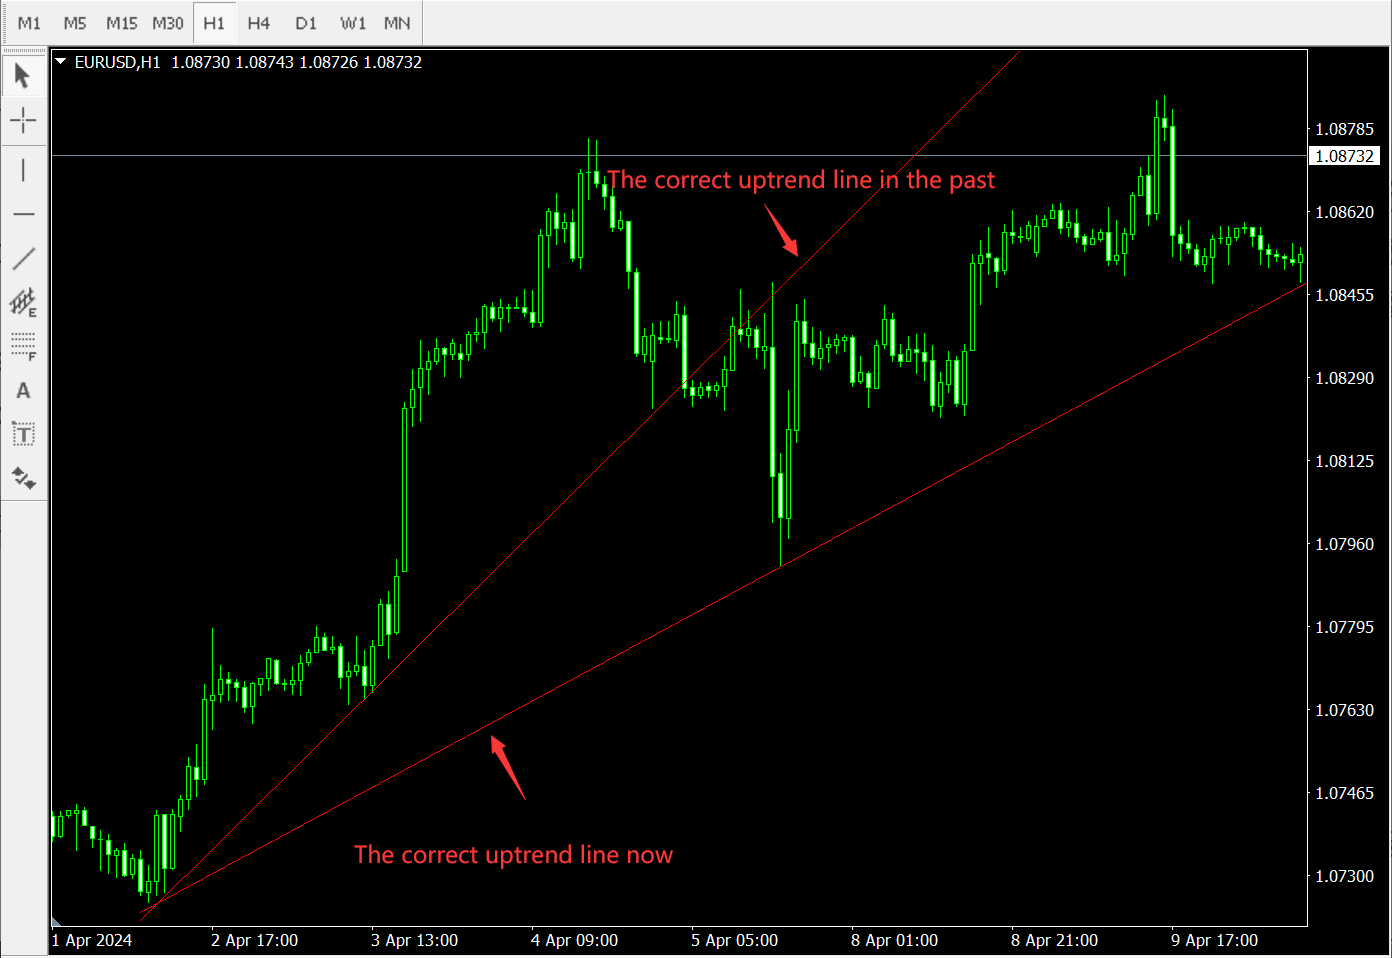
As shown in the chart below, the uptrend has ended, the trend line has been breached, the forex market has reversed, and the trend is downward, continuously making lower lows and lower highs. To draw an uptrend line, the market must be making higher highs and higher lows. The current situation is that the market is making lower lows and lower highs. Once the market stops making higher highs and higher lows and instead makes lower lows and lower highs, it means the market is reversing.
