I. Identifying and Drawing Downward Trend Lines in Forex Trading
One of the simplest things to learn in trading within the markets is that the market’s reaction to a downward trend is the same as to an upward trend, only in the opposite direction. This means that all the rules are the same, just reversed.
Contrary to the forex market creating higher highs and higher lows during an uptrend, in a downward trend, the market will form lower lows and lower highs. An upward trend line acts as a potential support level, from which the market is likely to bounce upwards. Conversely, when encountering a downward trend line, the market will turn downwards, forming resistance. In the market, a downward trend line acts like a ceiling, representing a potential resistance level.
It bears repeating that the best way to determine market direction is to draw trend lines. If the candlestick chart is above the trend line, the market is likely to continue upwards. If the candlestick chart is below the trend line, the market is likely to continue downwards. Drawing downward trend lines is a technique that anyone can learn.
I’ll reiterate, with apologies for the repetition, that the rules for drawing downward trend lines are the same as for upward trend lines, only inverted. All elements are simply flipped. While drawing an upward trend line connects points of support, drawing a downward trend line connects points of resistance.
II. Identifying and Drawing Short-Term, Mid-Term, and Long-Term Downward Trend Lines in Forex Trading
To draw a short-term downward trend line, connect the two nearest resistance points from left to right. Starting from the far left of the chart, draw a straight line connecting the major resistance points to create a mid-term downward trend line.
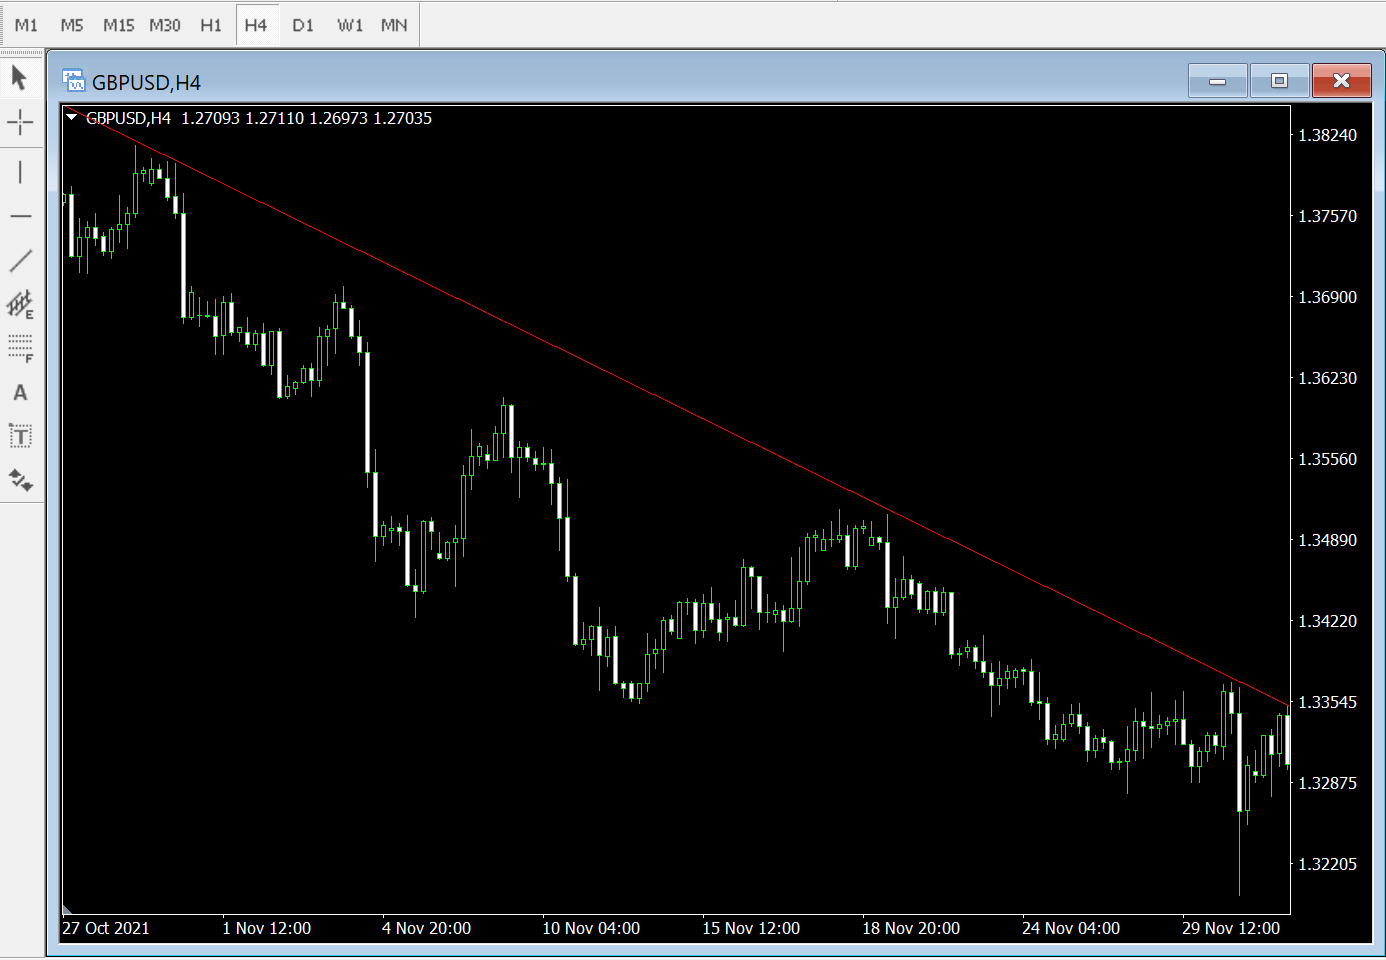
In other words, start from the left side of the chart, identify the highest point, then find the next lower resistance point, and draw a straight line downward at approximately 45 degrees. Connect two high points with a straight line without cutting through any candles. As long as the chart continues to produce lower highs and lower lows, your trend line should remain above the high points (see the chart below).

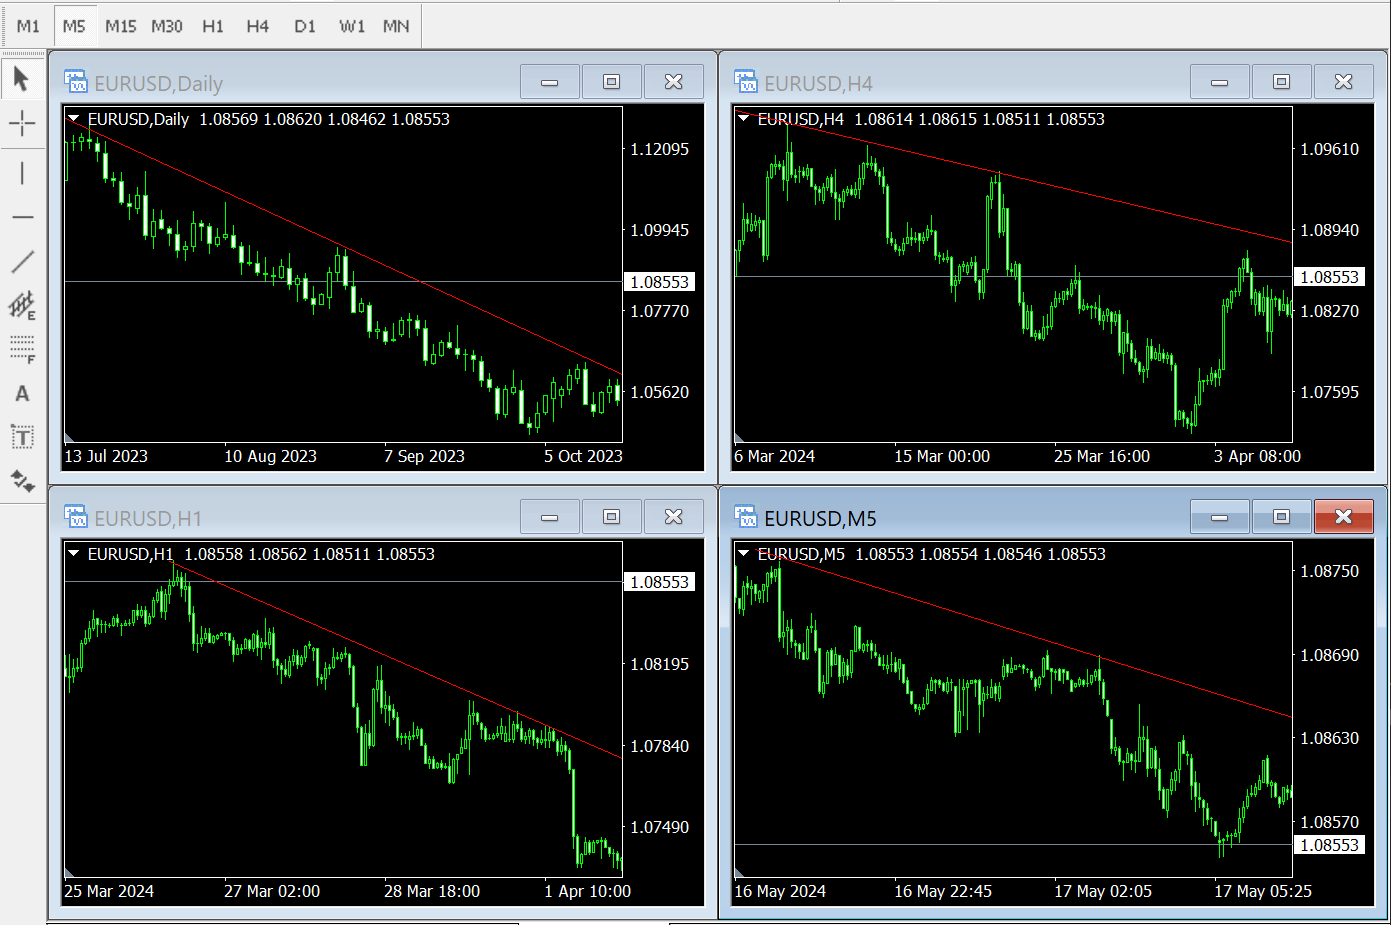
To draw a long-term trend line, you can zoom out on the chart or switch to a longer time frame, then start from the far left of the chart and connect your resistance points all the way to the right. Short-term and mid-term trend lines appear in all time frames; a short-term trend line drawn on a daily chart represents the recent days’ downtrend, while a mid-term trend line represents the downtrend over the past few months.
On an hourly chart, a short-term trend line represents the downtrend over the past few hours, and a mid-term trend line represents the downtrend over the past few days. It’s best to frequently zoom out on the time frame you are viewing to discover other mid-term or long-term trend lines.
Successful forex traders always monitor all downward trend lines across all time frames. Why? Because the trends in shorter time frames are always influenced by the trend lines of longer time frames. This means that if the market bounces up to a downward trend line on a daily chart, what appears as a 200-point bounce on the daily chart could be an uptrend on the 60-minute chart.
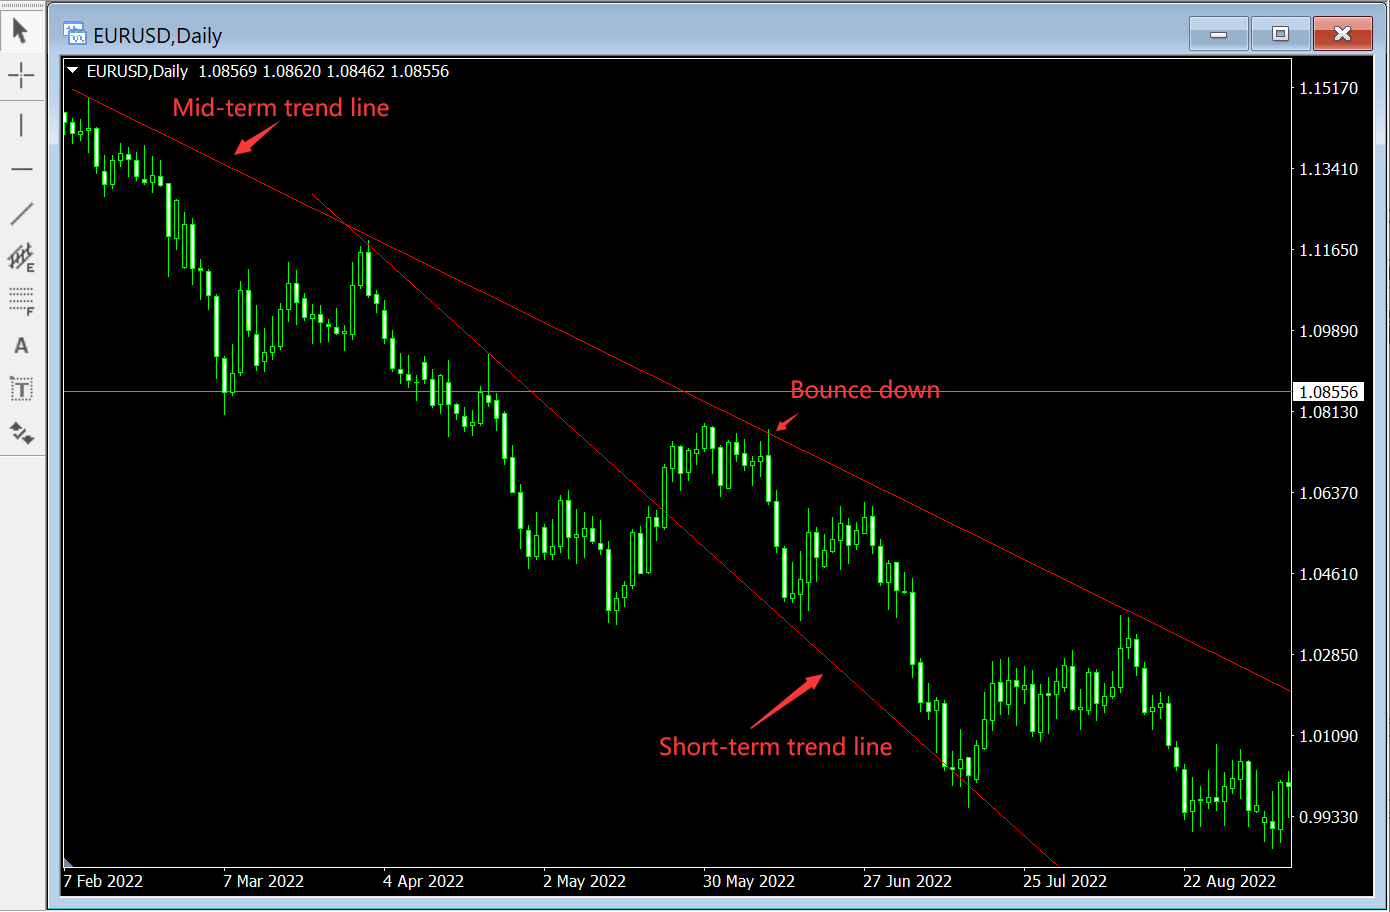
If you only analyze the 60-minute chart, you might see a strong uptrend and be inclined to be bullish, potentially trying to go long. However, as Murphy’s Law would have it, you might enter at the end of the uptrend on the 60-minute chart, and once the market hits the downward trend line on the daily chart, the 60-minute chart will reverse downward and begin to accelerate, at which point you can only lose. In any chart, at any time frame, we can find short-term, mid-term, and long-term upward trend lines (see the chart below).

The mid-term trend line indicates the overall trend of the market on that time frame’s chart, while the short-term trend line indicates the market’s recent trend.
As long as the forex market moves below the mid-term downward trend line, there is an 80% chance that the market will remain bearish. Remember, downward trend lines are potential resistance levels. They act like a ceiling, causing the market to bounce downward when it touches them.
If the short-term trend line is broken upwards, the forex market usually moves towards the mid-term trend line and bounces down from there. If the market breaks through the mid-term trend line, it will most likely move towards the long-term trend line and bounce from there. If the long-term trend line is breached, a major reversal usually occurs (see the chart below).

III. Common Mistakes in Drawing Downward Trend Lines
The mistakes made in drawing downward trend lines are the same as those made when drawing upward trend lines, only in the opposite direction. Traders need to learn to draw downward trend lines correctly to anticipate where the trend will bounce back down.
When drawing downward trend lines, you should not connect the high points of the candlestick bodies but rather the high points of the candlestick wicks.
As long as the market continues to make lower lows and lower highs, the drawn downward trend line must not cut through the candlestick bodies or wicks; it must connect the high points of resistance.
The end of a downward trend is signalled when the forex market stops making lower lows and lower highs and instead starts making higher highs and higher lows. At this point, the short-term, mid-term, or long-term downward trend lines have been breached, and generally, the market begins to move in the opposite direction.
IV. Trends within Trends in Forex Trading
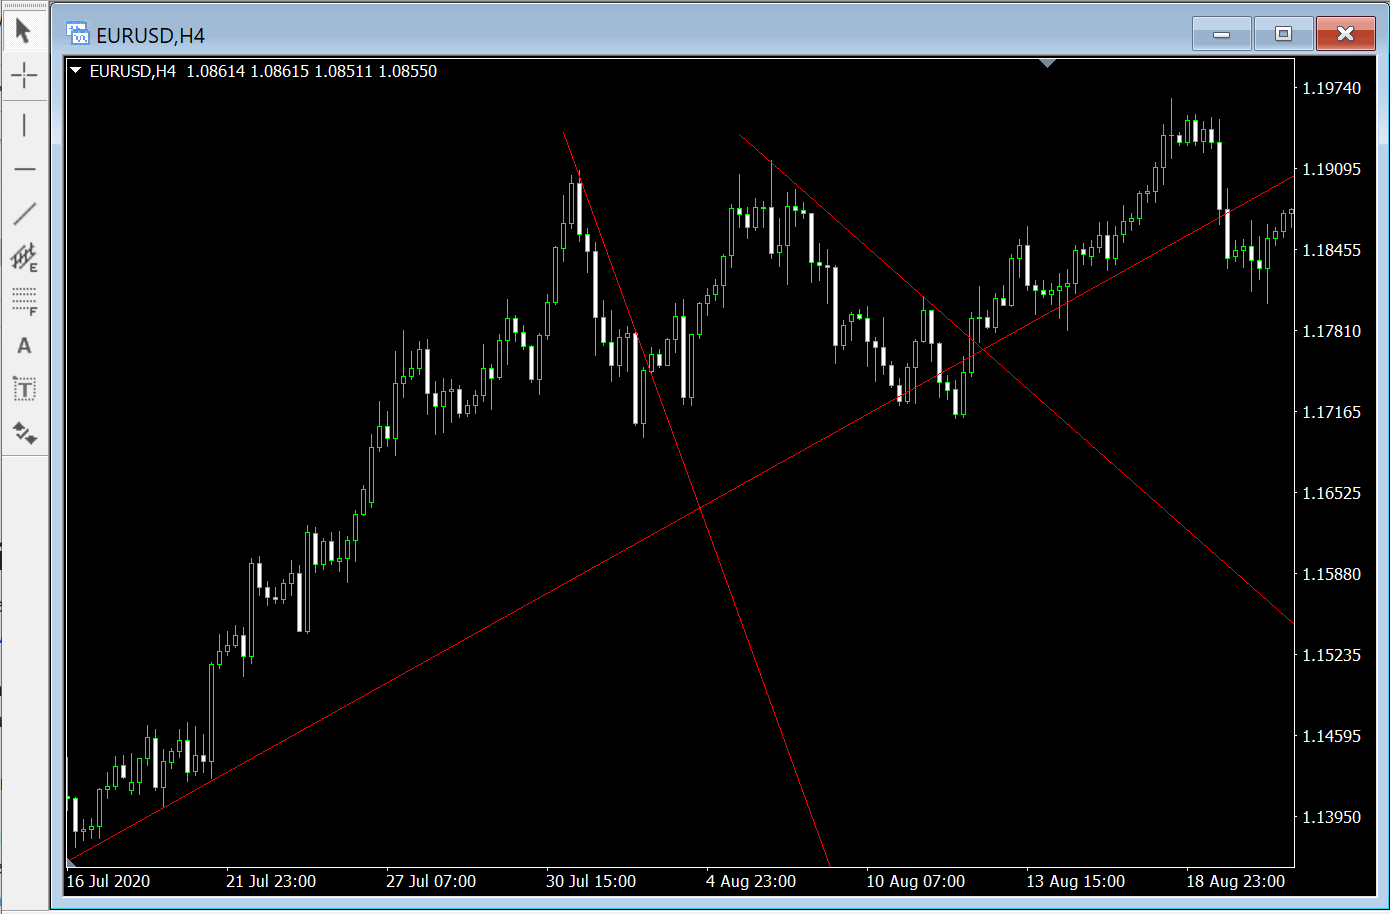
In the course of its movement, the forex market can form trends within trends. As shown in the chart below, you can see the market forming a strong uptrend above the mid-term trend line, then breaking through the short-term uptrend line, causing a short-term reversal.
The trend starts moving downwards, forming a short-term downward trend line, until it hits the mid-term uptrend line, where it begins to bounce back up, forming another short-term upward trend line.

V. The Value of Trend Lines in Forex Trading
Incorporating trend lines into your trading system and using them in conjunction with other indicators can increase your chances of success. Why? Because of the confluence effect, where multiple indicators confirm and support a forex trading decision at a single price point.
Both upward and downward trend lines not only indicate the market’s direction but also act as periodic support and resistance levels. A downward trend line is a potential point where the market will bounce down in a downtrend, and an upward trend line is a potential point where the market will bounce up in an uptrend. Regardless, trend lines are one of many factors that increase the probability of the continuation of a trend.