I. Trading in the Forex Market Resembles a Game of Strategy
It’s surprising how trading in financial markets resembles a game, but the reality is just that. Both sides fiercely compete to gain control over the market. Sometimes, one side reaps millions in profits while the other prays for the market to turn in their favor.
These traders concealed their behaviour, much like guilty children. However, the truth eventually surfaced. One trader, burdened by guilt after realizing the massive floating losses they had caused, confessed everything.
The Australian Securities and Investments Commission (ASIC) intervened, ordering the bank to close all losing positions immediately, resulting in the $360 million loss. Initially, the traders weren’t deemed criminals – just irresponsible. The lack of effective oversight by the bank’s executives led to their downfall. As the investigation continued, many believed that the real culprit was ASIC, as they demanded the bank close all losing positions. Unfortunately, shortly after the losses turned real, the traded currency began to reverse, leaving the bank in a dire situation.
Had these rogue traders remained silent and held their losing positions for another month, their paper losses would have decreased, possibly even turning into millions in profit for the bank. The bank’s executives might have been hailed as heroes instead of facing embarrassment. This legendary tale underscores that in the market, those who adhere to the rules ultimately succeed.
Now, consider this question: “Who exactly trades in the financial markets?”
- Banks? No.
- Pension funds? No.
- Brokers? No.
- Investment companies? No.
- Financial institutions? Still no.
The primary actors in financial markets are people – individuals representing various financial organizations. They make decisions that involve millions of dollars based on their thoughts, emotions, and fears.
II. Longs (Bulls) and Shorts (Bears) in the Forex Market
In the forex market, there are always buyers and sellers. In other words, some become long (buyers), while others join the short (selling) side. Despite both sides having access to the same information, their judgments about market trends diverge. It’s fascinating. While bulls and bears have distinct characteristics, they share one common goal – profiting from the market.
As a forex trader, understanding this information is crucial. Imagine going long, becoming part of the bullish camp, and seeking an optimal exit point. Ideally, you’d exit just before the market hits a new high. Why? Because once the market reaches new highs, strong pullbacks often follow, potentially erasing your profits.
I’ve received countless calls from traders saying, “I know where to enter, but I don’t know where to exit! After entering, I act like a greedy fool, hoping the market will skyrocket. But unexpectedly, it suddenly reverses to my entry-level, wiping out all my gains.”
Ignorant traders rely on emotions rather than logic, knowledge, and information as their trading guide – inevitably leading to failure.
III. Longs (Bulls) Create Higher Highs, Shorts (Bears) Create Lower Lows
Whether you believe it or not, things are often quite simple. Have you ever noticed that the most common things in life are often the easiest to overlook?
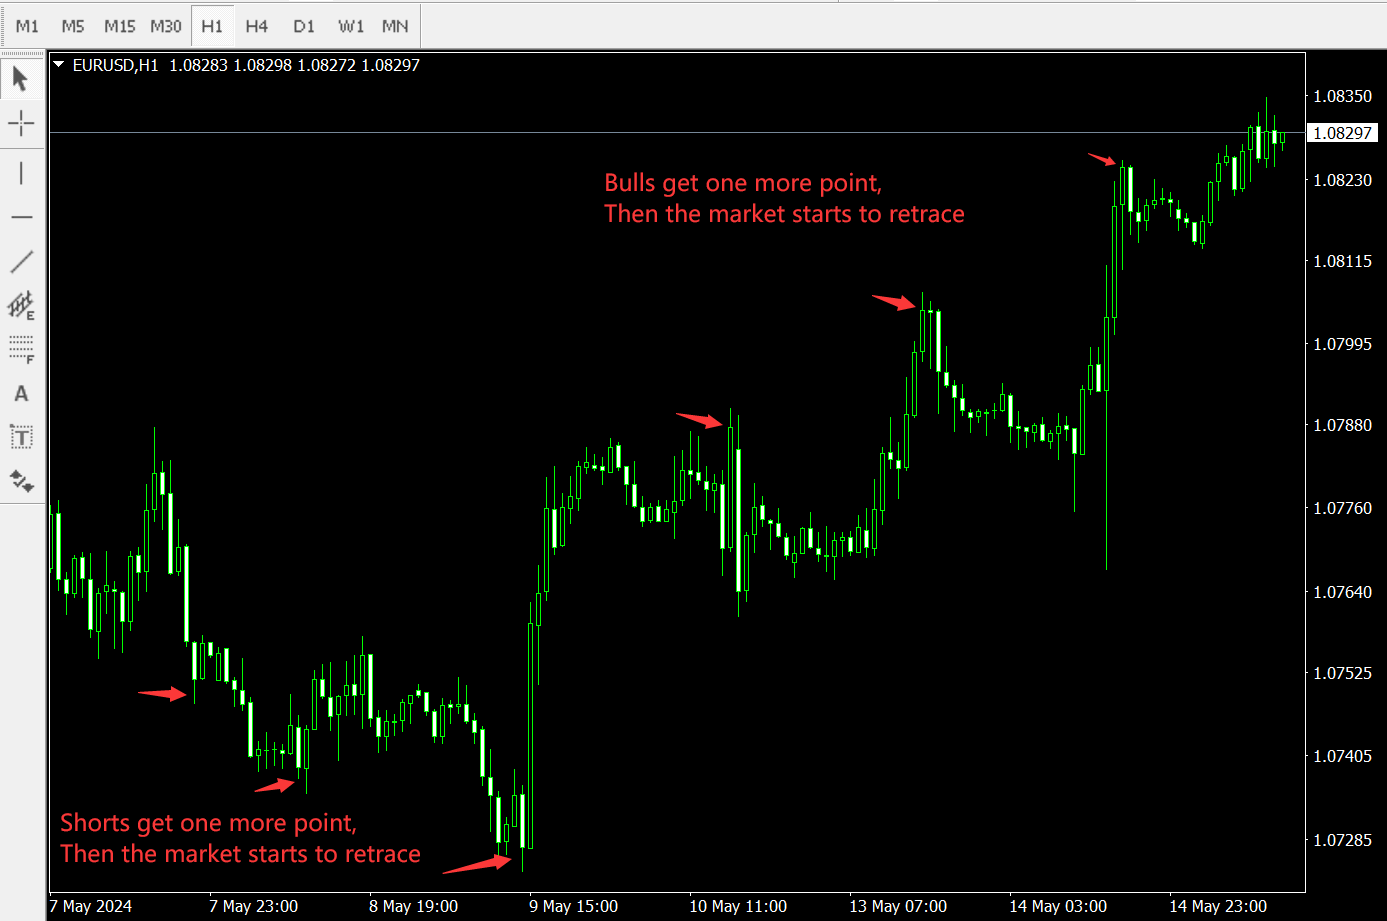
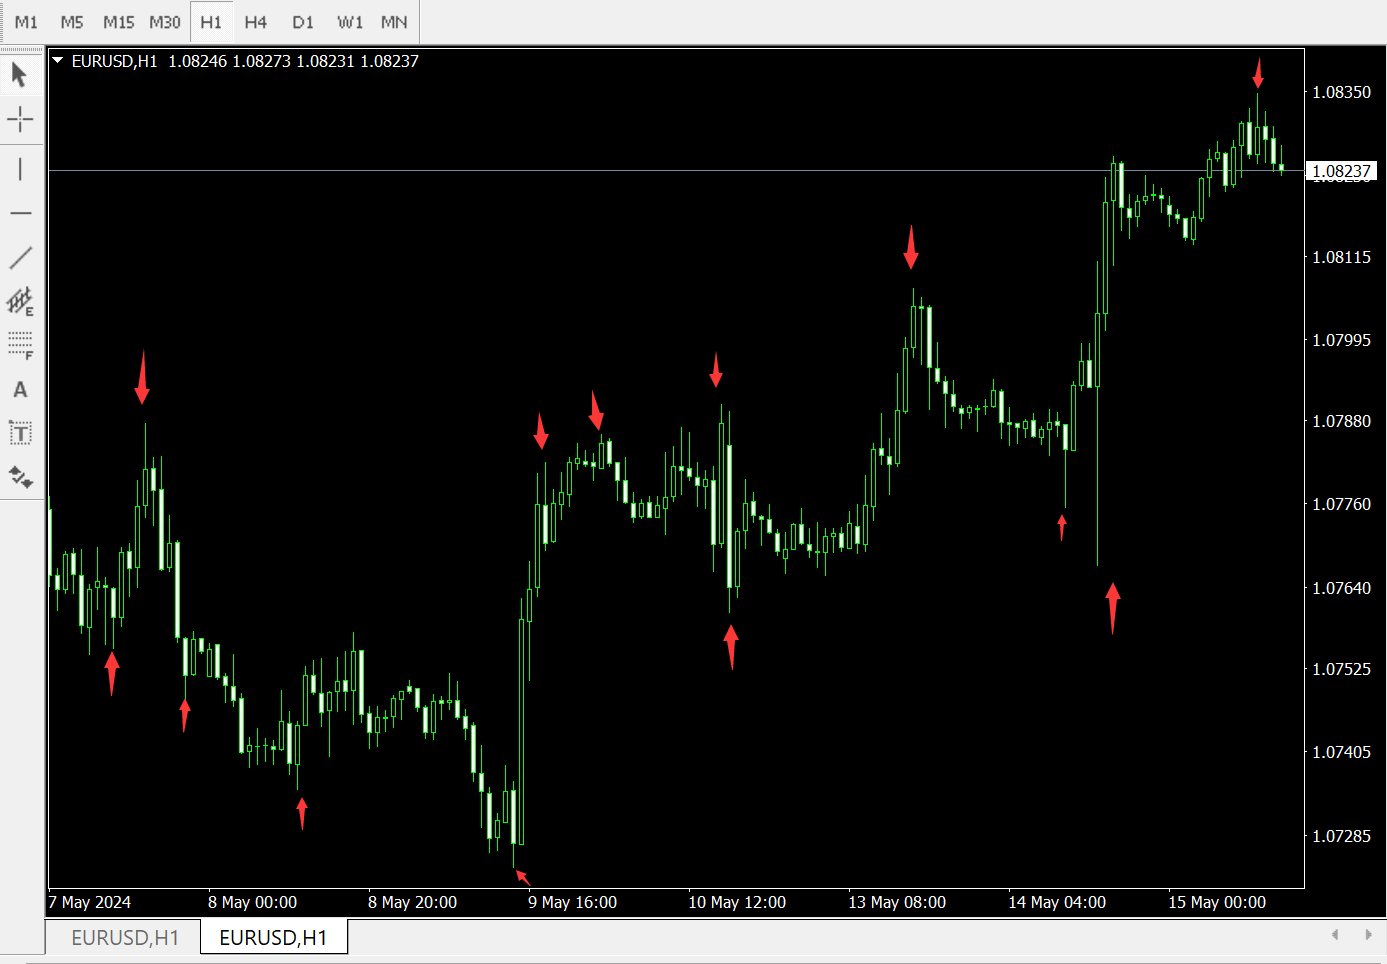
Longs (bulls) and shorts (bears) continuously monitor all the highs and lows in the forex market. When the market creates a new high that surpasses the previous high, the longs score a point. In other words, at this high point, longs make a profit. Following the new high, there is often a market pullback. Conversely, shorts work to drive the market down, consistently creating new lows to profit. Of course, after the new low, a rebound often follows (see the diagram below).

The memory of longs and shorts is as good as an elephant’s—they never forget!
IV. Identify Highs and Lows in Forex Trading
A high point occurs when the highest point of a candle’s body or shadow is higher than the highest points of the two adjacent candles. To confirm a high point, check if the candle’s shadow high is lower than the highs of the two candles on its left and right.
The identified high point can serve as a resistance level.
For example, the current resistance level is a high point lower than the previous high point (see the chart below).
A low point occurs when the lowest point of a candle’s body or shadow is lower than the lowest points of the two adjacent candles. To confirm a low point, check if the candle’s shadow low is higher than the lows of the two candles on its left and right.
The identified low point can serve as a support level.
For instance, the current support level is a low point higher than the previous low point (see the chart below).

V. Support and Resistance in the Forex Market
Around the clock, seven days a week, bulls and bears vie for control in the market. Bulls strive to keep the market rising, reaching new highs, while bears do the opposite.
Support and Resistance refer to the levels created by the market’s new lows or highs. In the early 20th century, stock traders first introduced these concepts. Here’s how they work:
-
Support in the Forex Market
Support occurs during a downtrend when traders believe a stock is undervalued and start buying, preventing further decline.
It’s like a safety net for prices, where demand exceeds supply.
When support holds, prices tend to bounce back. -
Resistance in the Forex Market
Resistance occurs during an uptrend when traders believe prices are too high and stop buying.
It acts as a ceiling for prices, where supply exceeds demand.
When resistance holds, prices tend to reverse or consolidate.
Traders look for these levels to make informed decisions. Whether you’re a bull or a bear, you want to buy low and sell high. This perpetual game of price levels has been ongoing since human trading began, and now we can monitor it using charts.