I. Non-data Forex Trading Days vs. Data Forex Trading Days
Non-data trading days refer to those without the release of key fundamental data. On such days, due to different currency pairs, the typical fluctuation range is 60-90 points, sometimes reaching up to 120 points. Data trading days are when key fundamental data is released, and the forex market often runs unilaterally for 120-240 points within 5 hours after the data release, with significant changes, followed by narrow consolidation for the rest of the day.
Trading novices prefer non-data trading days because the market is more predictable. In contrast, master traders prefer data trading days as they can achieve greater profits in a shorter time.
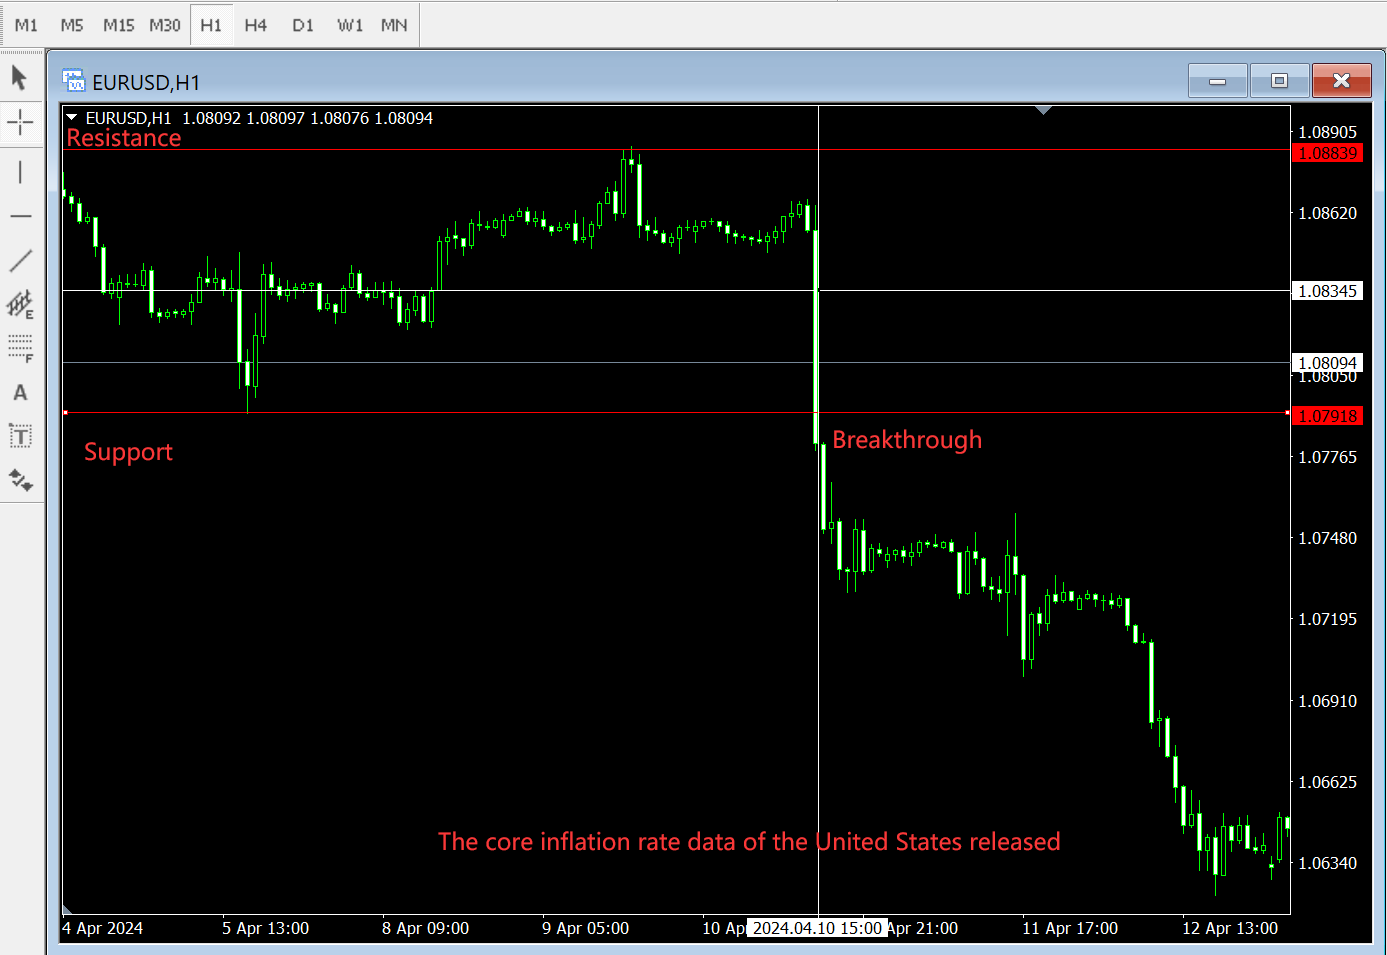
With the release of fundamental data, if the market expects significant economic changes, the exchange rate will move in a certain direction (see the chart below).


The figure shows that before the data release, traders begin to pause their trades. The exchange rate starts to consolidate or oscillate within a range, signalling the impending release of fundamental data.
Traders wait at this time and enter the forex market after the data is released. Trading appears light or calm, and if the results show a significant change compared to the previous value, the market often breaks out of the pre-data oscillation range, as shown in the chart above, due to traders buying or selling heavily after the data release, causing a sharp drop in the exchange rate.
If the data results are not significantly different from the previous values, the market often continues the previous trend direction.
II. Risks of Forex Trading Fundamental Data
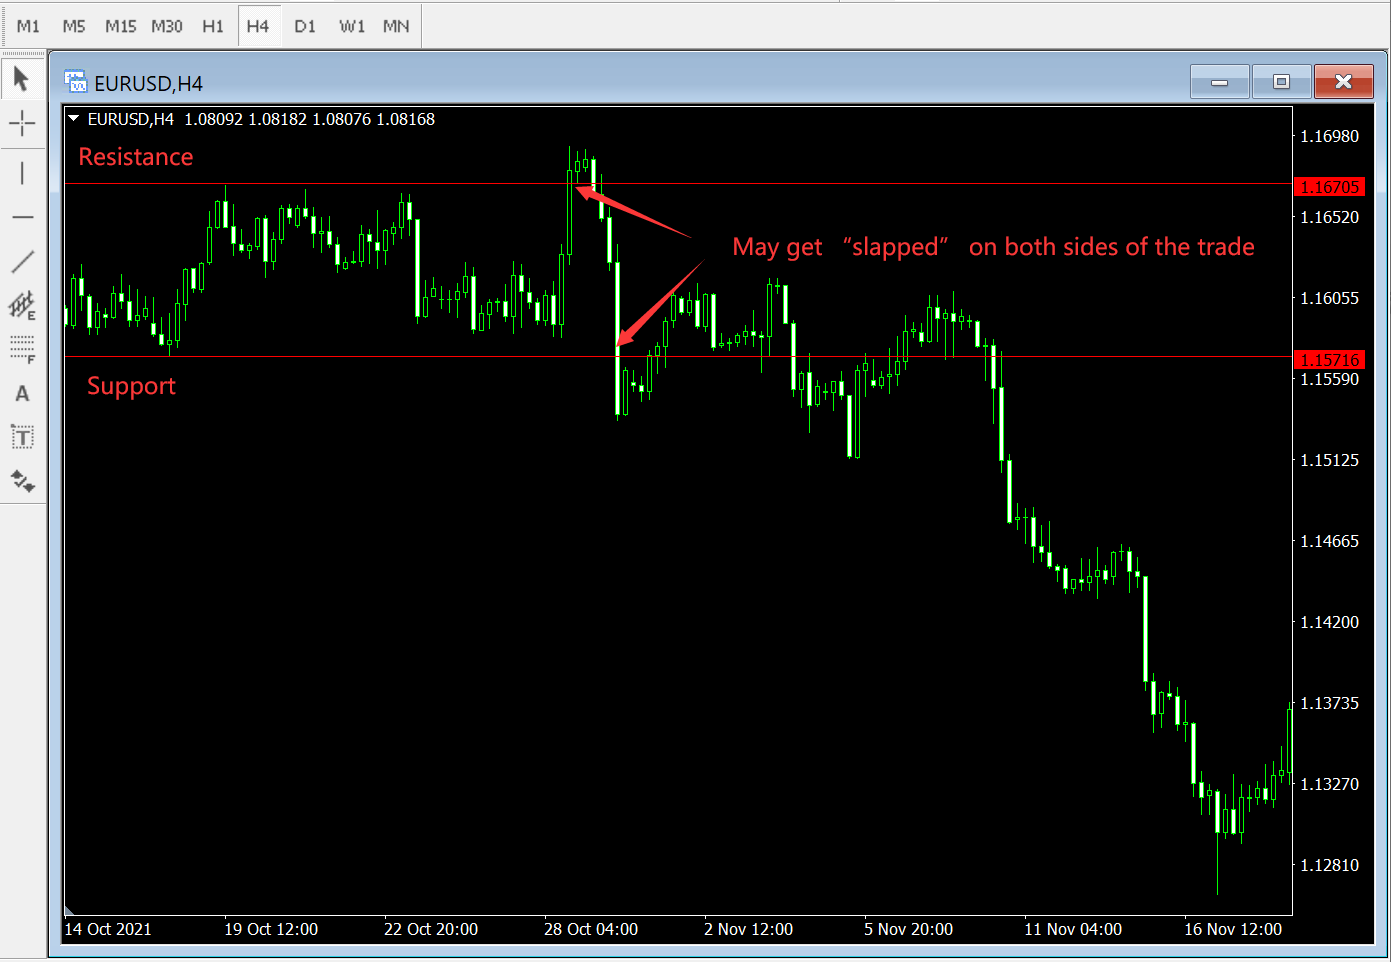
Traders need to be extra cautious on trading days when key data is released. Trade on when the news releases, forex brokers allow for stop and limit orders, meaning traders can place long orders above the pre-data oscillation range and short orders below it. As the results of data or event risks are published, the market may immediately break through the oscillation range in a certain direction and trigger one of the trader’s orders.
The market volatility caused by fundamental data can lead to unavoidable losses, as traders may get ‘slapped’ on both sides of the trade (see the chart below).

III. World Economic Information
Traders generally focus on three major forex markets:
- Asian Market
- European Market
- US Market
The majority of forex trading volume is completed in the UK, with over 75% of forex trades occurring during the European session, and most of the daily $1.5 trillion trading volume is between the seven major currencies.
Small retail traders trade the Euro, British Pound, Swiss Franc, Canadian Dollar, and Australian Dollar against the US Dollar, with the vast majority settled in US Dollars.
The financial market is a world that never sleeps. In fact, the sun itself never sets—the Earth is continuously rotating, so financial markets around the world open and close in succession. The forex market is a financial market that is open 24 hours a day.
At 7 PM Eastern Time, the Asian market opens (8 AM local time in Asia, lasting nearly 8 hours). At 3 AM Eastern Time, the European market opens (8 AM local time in the UK, lasting nearly 8 hours).
At 8 AM Eastern Time, the American market opens, lasting 8 hours.
You’ll find that the three markets are interconnected, but the bulk of trading volume occurs during the European and US sessions. In the 24-hour continuous market fluctuations, most also occur during these two periods.
If you’re interested in trading peripheral currencies relative to the major ones, you’ll need to pay attention to the financial calendar of specific countries. For example, if you want to trade the AUD/NZD, you’ll need to study the key data that might affect these two currencies.
Remember, the importance of data changes over time. If a country’s economy is deteriorating, retail sales data may become an important focus, potentially becoming a major driver of market fluctuations and triggering significant forex market movements. However, if the economy is strong, retail sales data, whether good or bad, are unlikely to have a significant impact on exchange rates.
IV. Important Fundamental Data in Forex Markets
To some extent, fundamental data affects the performance of each country’s currency. This impact can be immediate or delayed. Central banks of each country use economic indicators to monitor inflation.
If data indicates increasing inflationary pressures, central banks may raise interest rates; if deflation signs are evident, they may lower rates. Interest rates significantly influence individuals’ and households’ borrowing and investment decisions, thus having a substantial impact on the economy. Raising rates can temper an overheated economy while lowering rates can stimulate growth.
V. The 11 Important US Fundamental Data in Forex Markets
The key US fundamental data are as follows:
-
Purchasing Managers’ Index (PMI): This index surveys over 200 purchasing managers in the Chicago area, reflecting the development of the entire US manufacturing sector. An index above 50 indicates good business expansion, while below 50 indicates contraction. This data is typically released at 10 AM (Eastern Time) on the last trading day of each month.
-
Consumer Confidence Index (CCI): This index surveys 5,000 consumers about their current and future economic outlook. Sometimes it helps predict sudden economic shifts, aiding traders in assessing the direction of the US economy. A change of more than 5 points is considered significant. This data is generally released at 10 AM (Eastern Time) on the last Tuesday of each month.
-
Consumer Price Index (CPI): The CPI measures the price changes of a representative basket of goods and services, such as food, energy, housing, clothing, transportation, medical care, entertainment, and education, also known as the cost-of-living index. The core CPI, excluding food and energy, more clearly shows the outlook for underlying inflation trends. CPI data is typically released around the 13th of each month at 8:30 AM (Eastern Time).
-
Durable Goods Orders: Officially named “Durable Goods Manufacturing, Shipments, and Orders Report,” this index reflects the status of US durable goods orders, shipments, and pending orders. Durable goods are products expected to last three years or more. Due to the data’s volatility, the market usually focuses on results excluding defense and transportation orders. Durable goods orders data reflect the demand for US-made durable goods domestically and internationally. Rising data indicates increased demand, implying higher production and employment, and vice versa. This data is generally released around the 26th of each month at 8:30 AM (Eastern Time).
-
Nonfarm payrolls: This report publishes data on non-agricultural business and government agency employment numbers, unemployment rate, average hourly earnings, weekly earnings, average workweek, etc. Due to its fixed release schedule, high accuracy, and significance as an economic activity indicator, this data receives the most market attention and influences financial market sentiment every month.
The non-farm employment indicator is a concurrent indicator of economic growth. The larger the increase in non-farm employment, the faster the economic growth. An increase in the unemployment rate indicates slowing economic growth and potential rate cuts. A decrease in unemployment suggests economic expansion and possible rate hikes. If unemployment is too low, hiring difficulties may increase, potentially raising wages. An unemployment rate between 5.5% and 6.0% is considered full employment. This report is typically released at 8:30 AM (Eastern Time) on the first Friday of each month.
-
Existing Home Sales: This data records the sale of previously owned homes, reflecting the overall condition of the real estate market and the economic situation. People consider buying homes only when they have financial confidence. This data is generally released at 10 AM (Eastern Time) on the 25th of each month.
-
Gross Domestic Product ([GDP]): US GDP data measures the total output of goods and services within the US (regardless of asset ownership or the specific nationality of the labor force), representing the most comprehensive indicator of US economic performance. A healthy GDP growth rate is generally between 2.0% and 2.5% (with unemployment simultaneously maintained at 5.5% to 6.0%). Too rapid GDP growth may accelerate inflation, while a slowdown may indicate a softening economy. This data is typically released on a Friday around the third or fourth week of each month at 8:30 AM (Eastern Time).
-
New Home Sales: This data surveys nearly 10,000 builders or 15,000 building project owners, recording the number of new homes sold during the month. It indicates the near-term prospects for family-related projects and consumer spending. However, investors tend to focus more on existing home sales, as they usually account for over 84% of all home sales in a month.
-
Philadelphia Fed Manufacturing Index: This regional manufacturing index mainly covers Pennsylvania, New Jersey, and Delaware, indirectly reflecting the performance of manufacturing activities across the US. An index above 50 indicates good business expansion, while below 50 indicates contraction. This data is generally released at 10 AM (Eastern Time) on the third Thursday of each month.
-
Producer Price Index (PPI): The PPI measures the price changes of a fixed basket of capital and goods at the wholesale stage, more clearly reflecting potential inflation trends. The PPI primarily covers changes in prices of finished goods, raw materials, and intermediate goods. Additionally, the PPI data excluding food and energy should be noted. This data is typically released around the 11th of each month at 8:30 AM (Eastern Time).
-
Retail Sales: This data measures the sales status of all retail businesses in the US, unadjusted for inflation. However, the data is adjusted for seasonal, holiday, and other factors. Retail sales are considered the most timely data reflecting overall consumer spending, showing trends in different types of retail businesses, which help identify specific investment opportunities. This data is typically released around the 12th of each month at 8:30 AM (Eastern Time).
The above economic indicators have the greatest impact on the forex market’s six major currencies, but they are not the only ones. Once again, you can check all the fundamental data or events affecting the forex market in the Dailyfx.
We recommend to guard against unexpected market fluctuations, that you review the financial calendar before trading.
VI. Summary of The Important Fundamental Data in Forex Trading
Paying attention to fundamental data before trading is crucial. It’s best to habitually check whether important fundamental data is about to be released, as these can cause market fluctuations.
Trading when data is released is like navigating a turbulent river; trading when no data is released is like sailing on calm waters. It’s advisable for trading novices to avoid potentially volatile periods and focus on trends they understand. Don’t be blinded by a false sense of security; just because you’ve checked the financial calendar and no key data is announced, don’t assume the market will calm down.
At any time, unanticipated data releases or events can have a huge impact on the forex market.